PT Erajaya Swasembada Tbk's management explains the business in its own materials. The slides below do the most of that work, pulled from the documents preserved in Sources. Each source link opens the complete presentation at that slide in a new tab.
The current company update: what each vertical is, how the store network is built, and the latest P&L, segment mix and unit economics. · Open the full document →
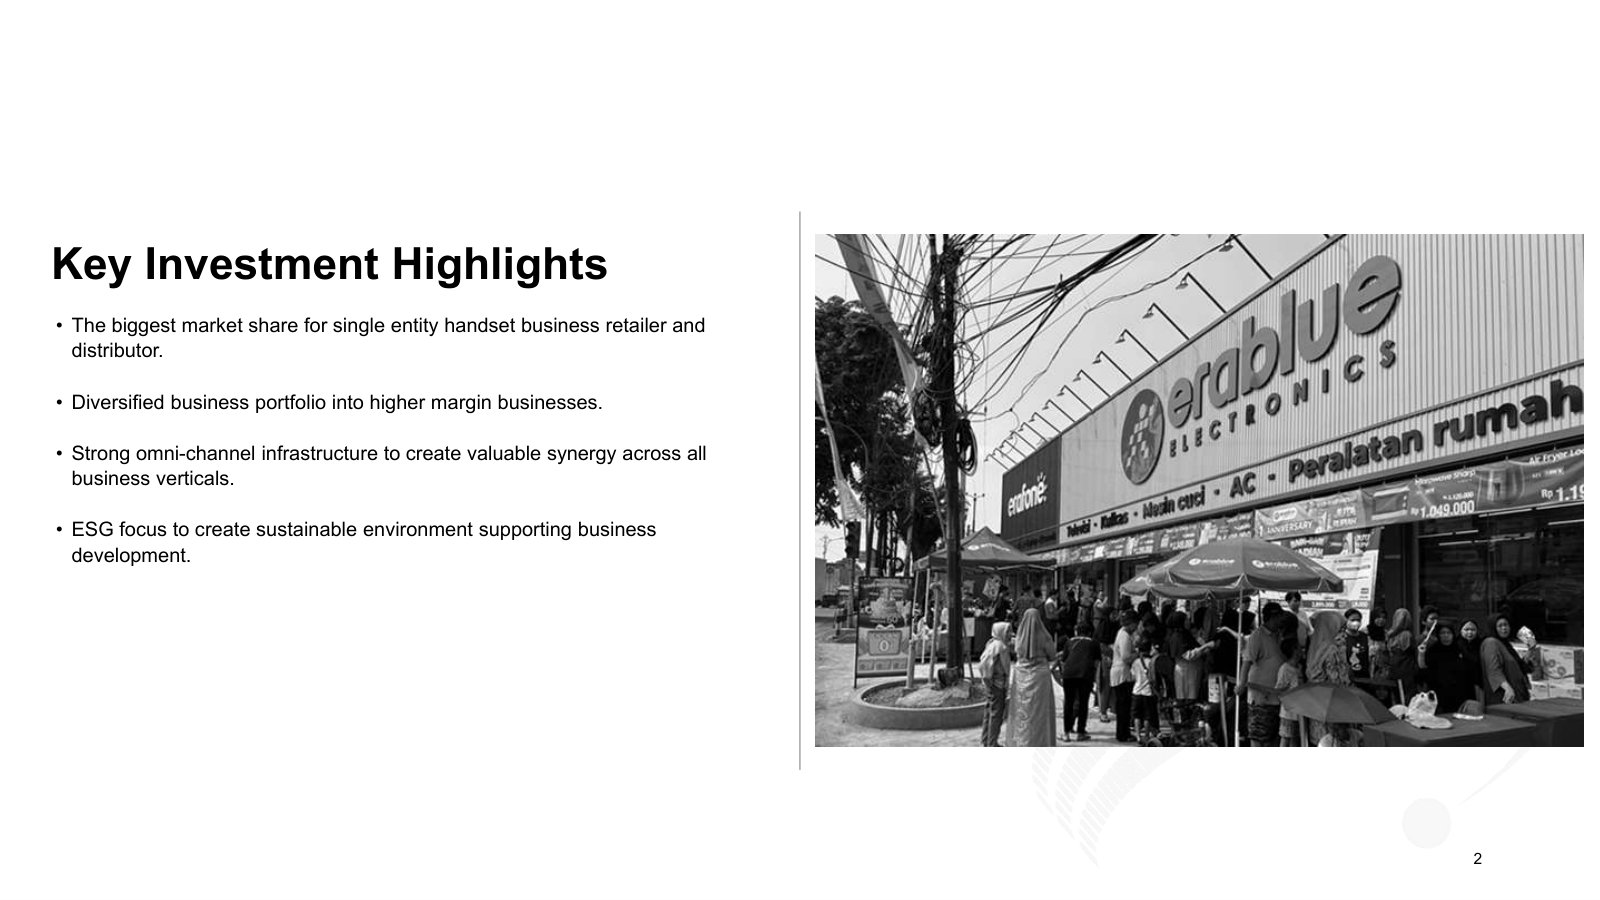
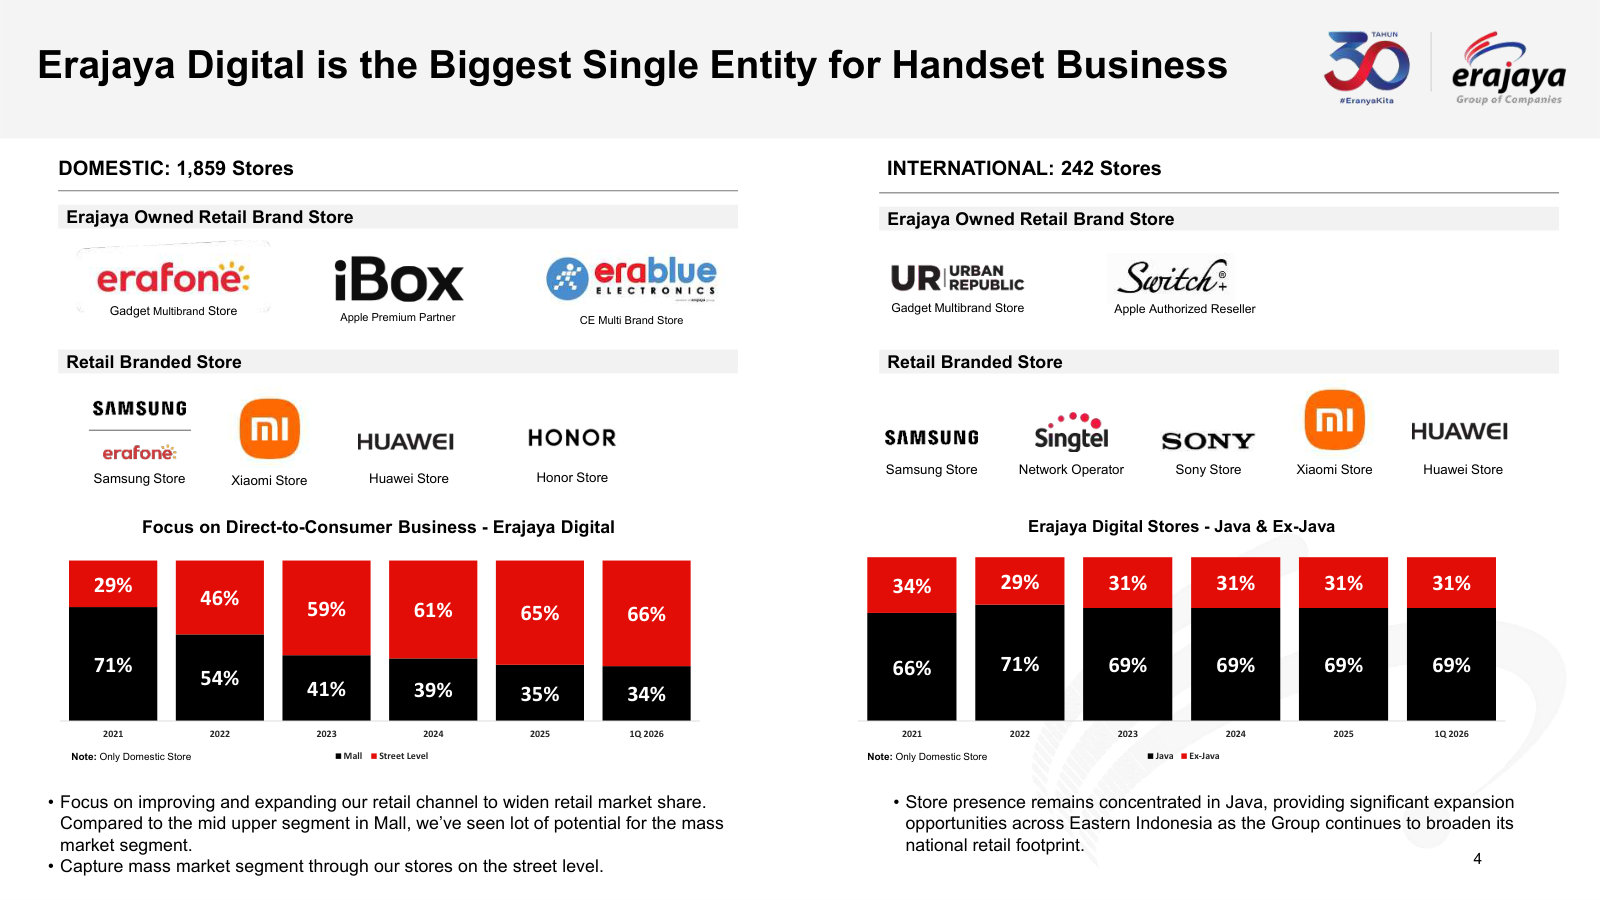
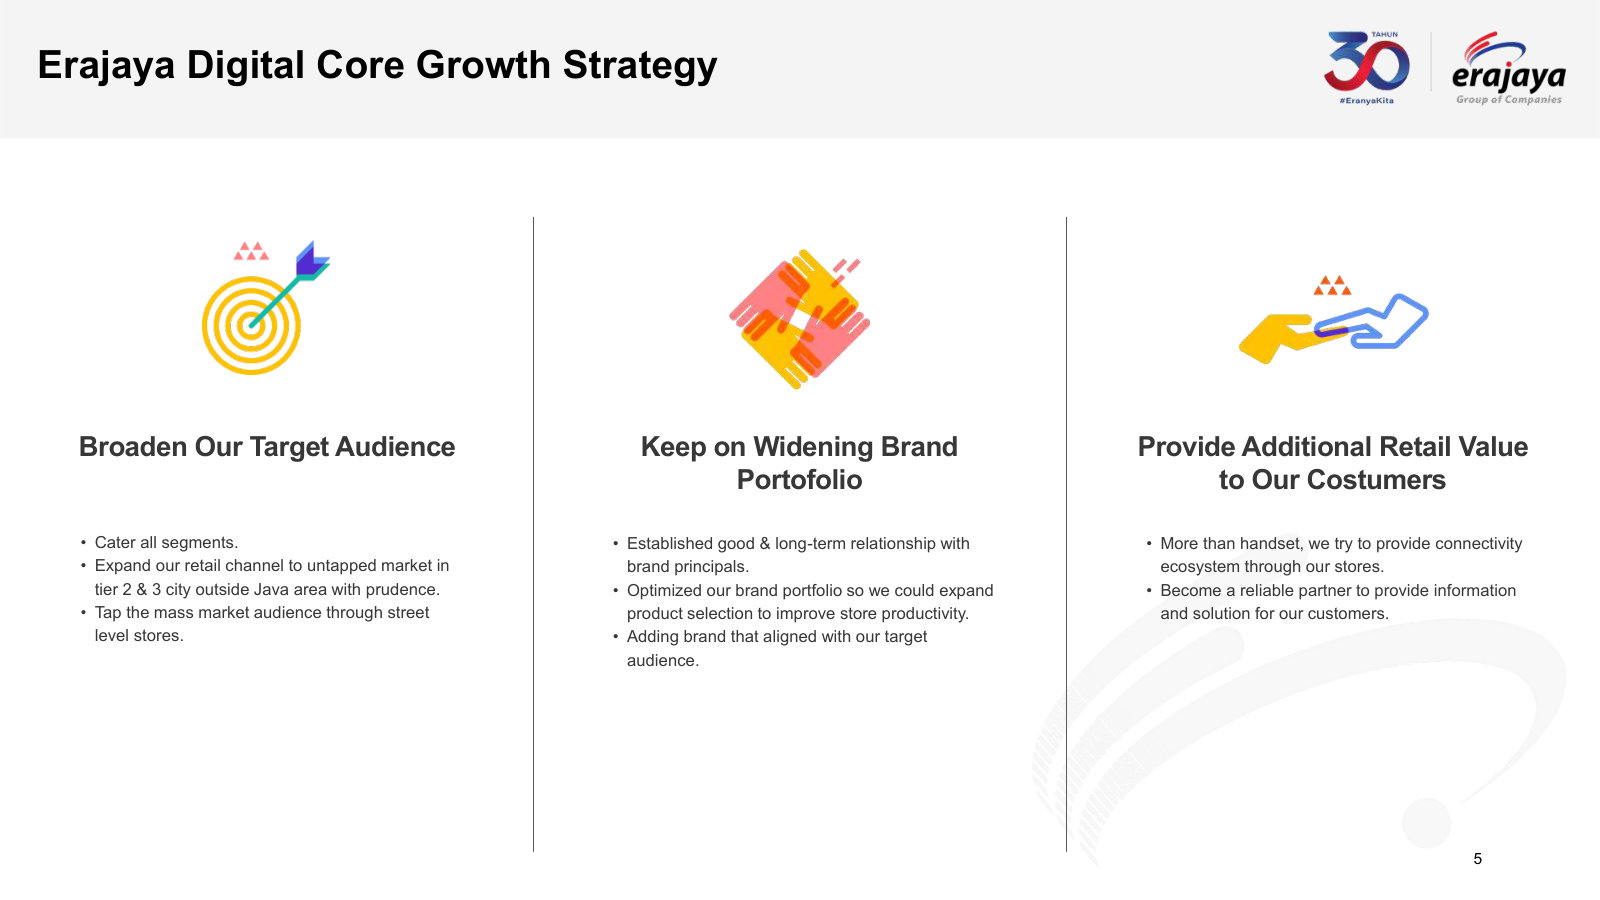
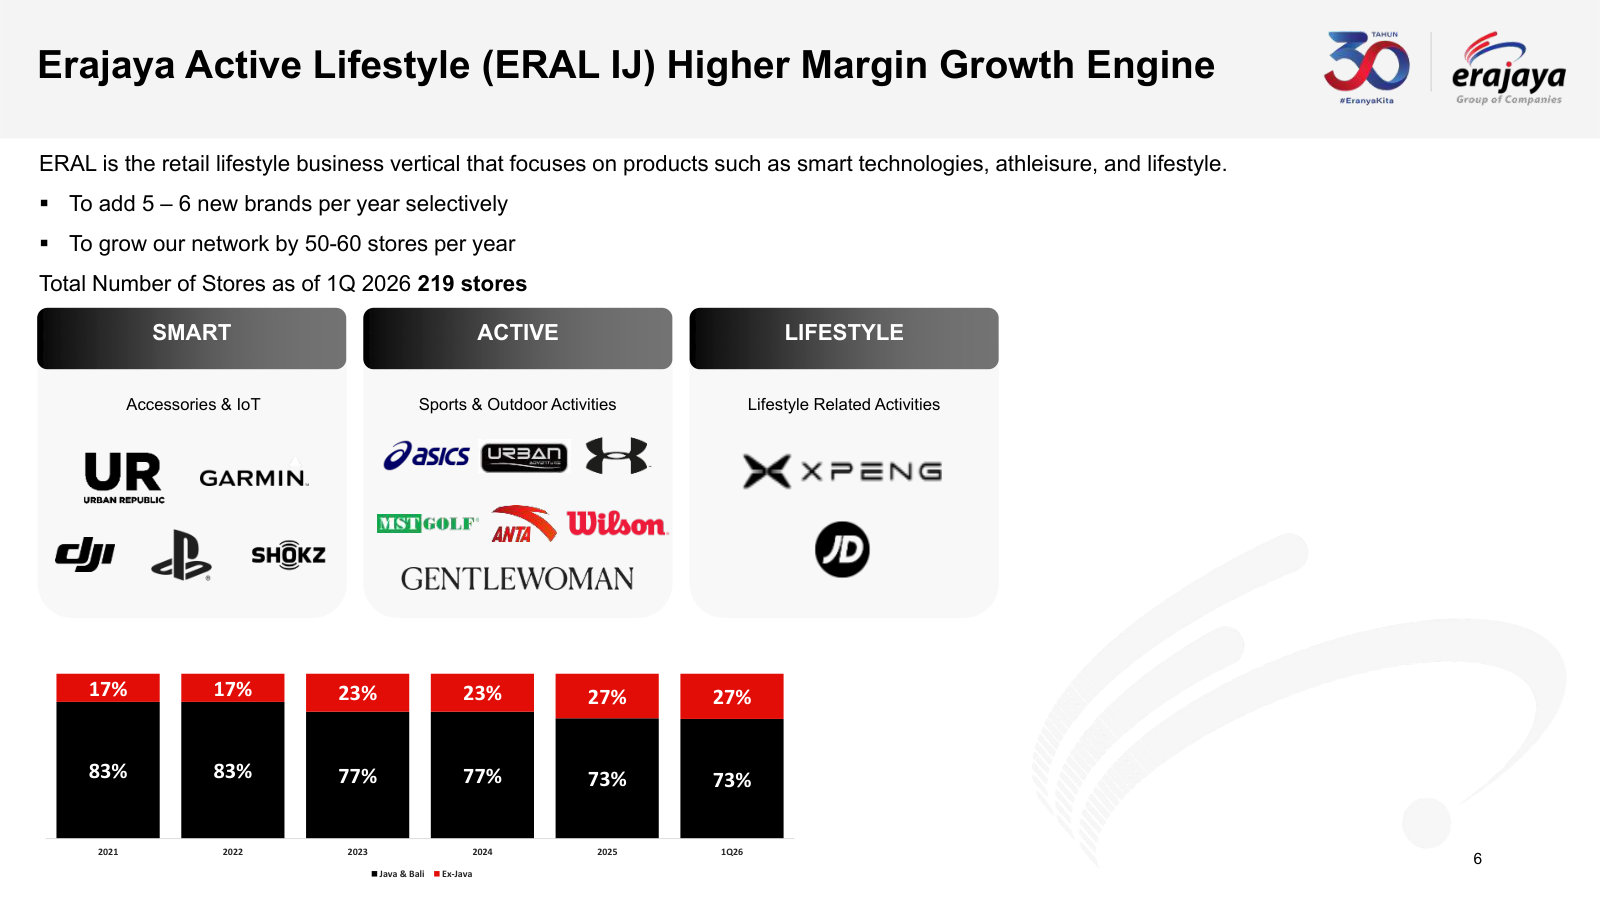
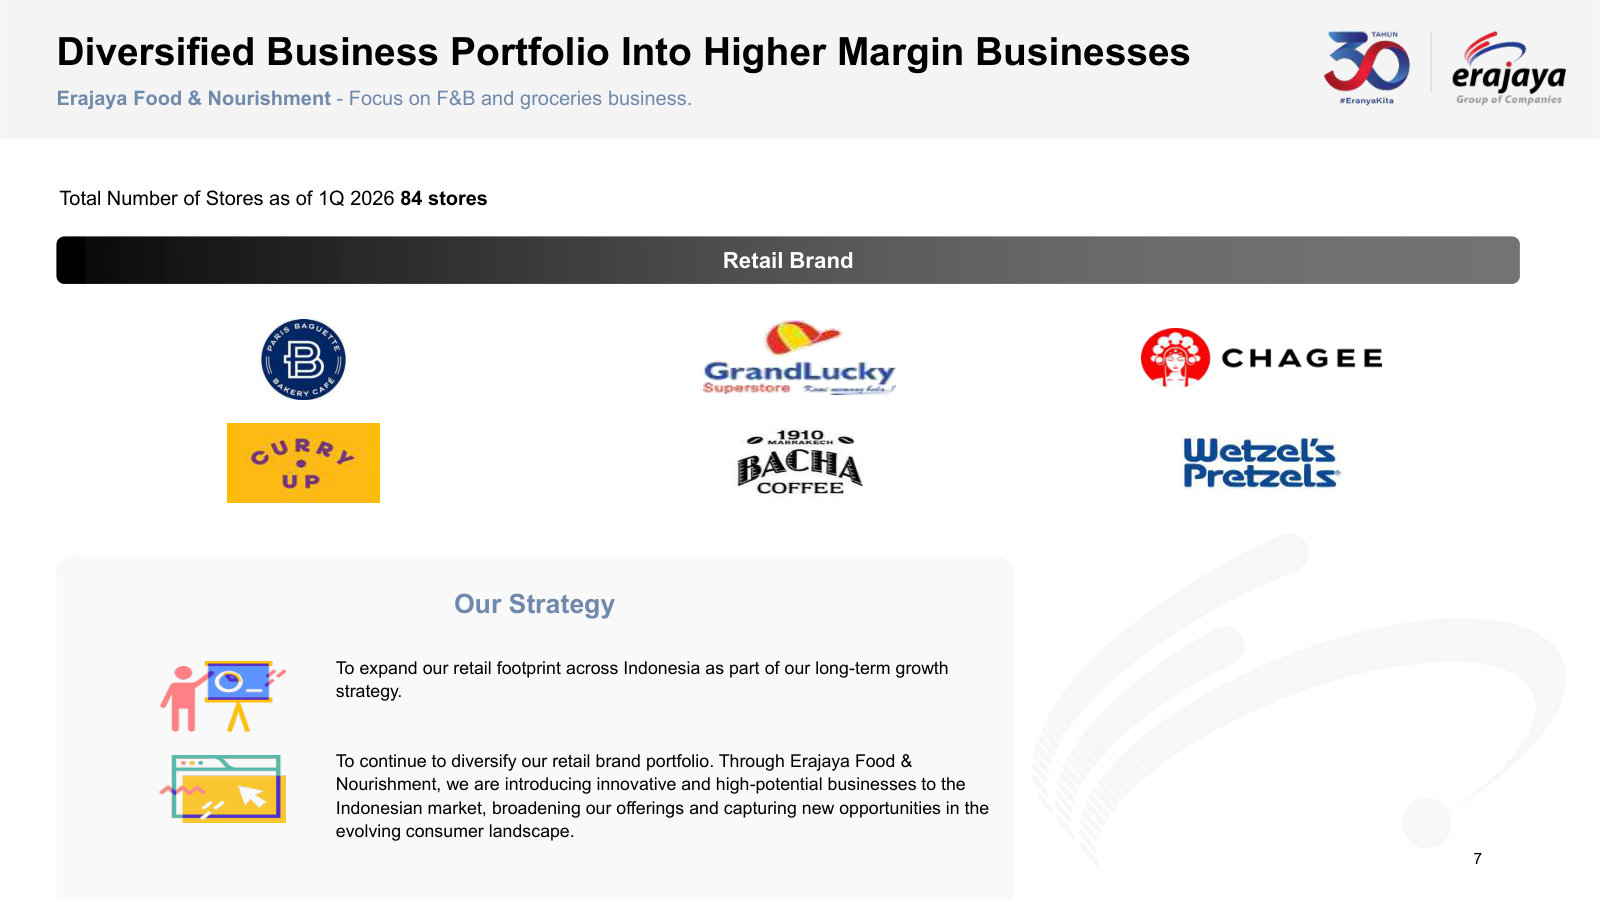
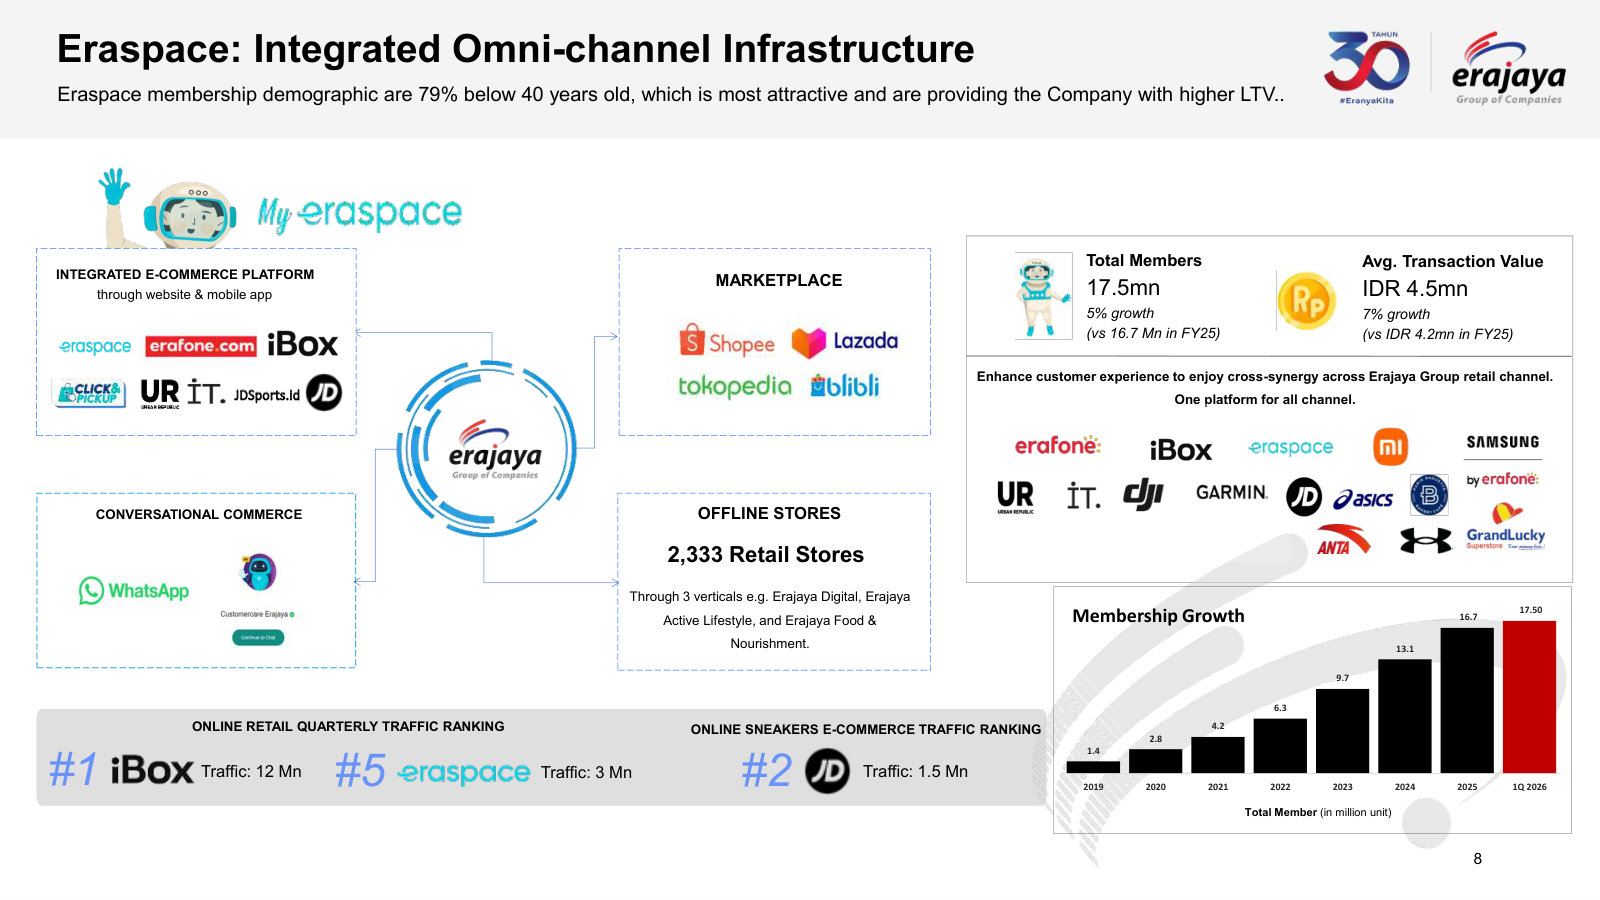
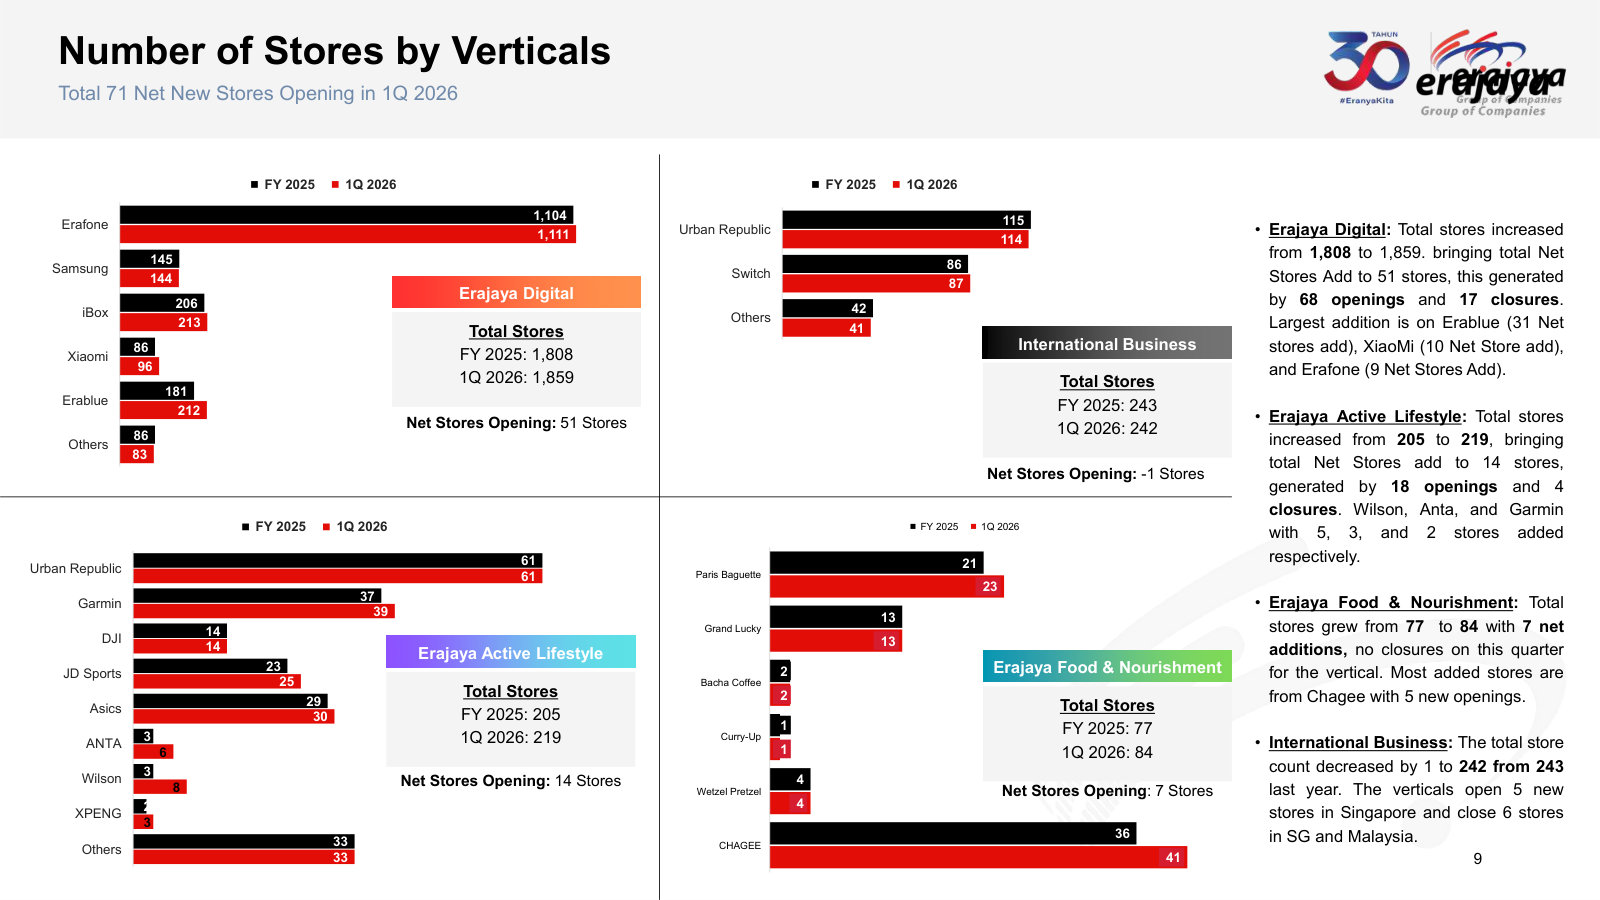
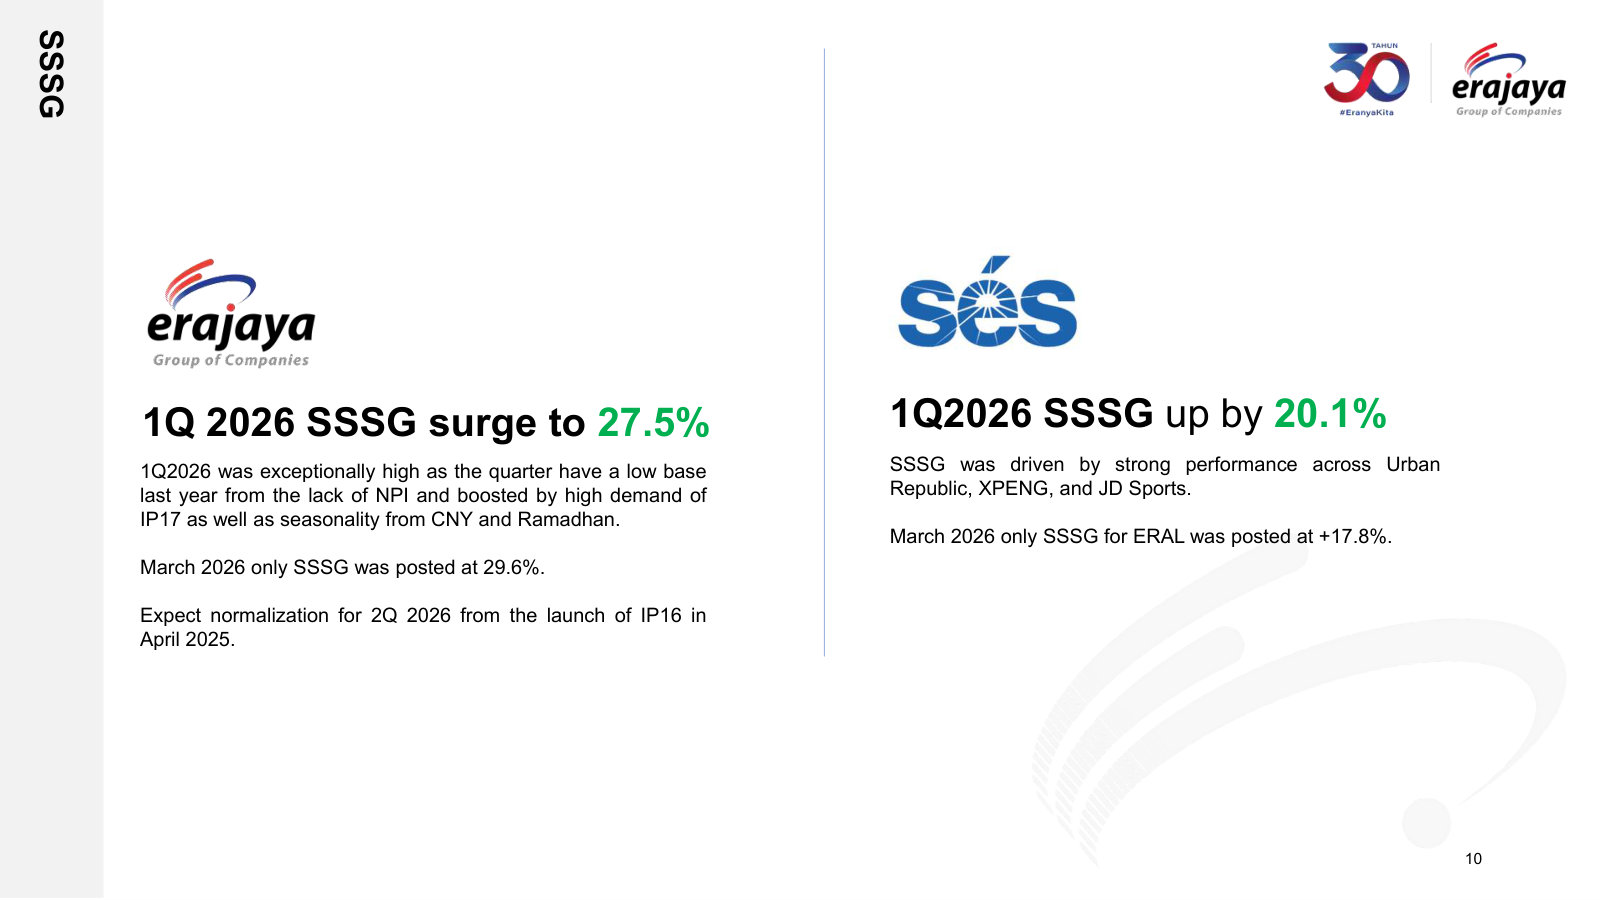
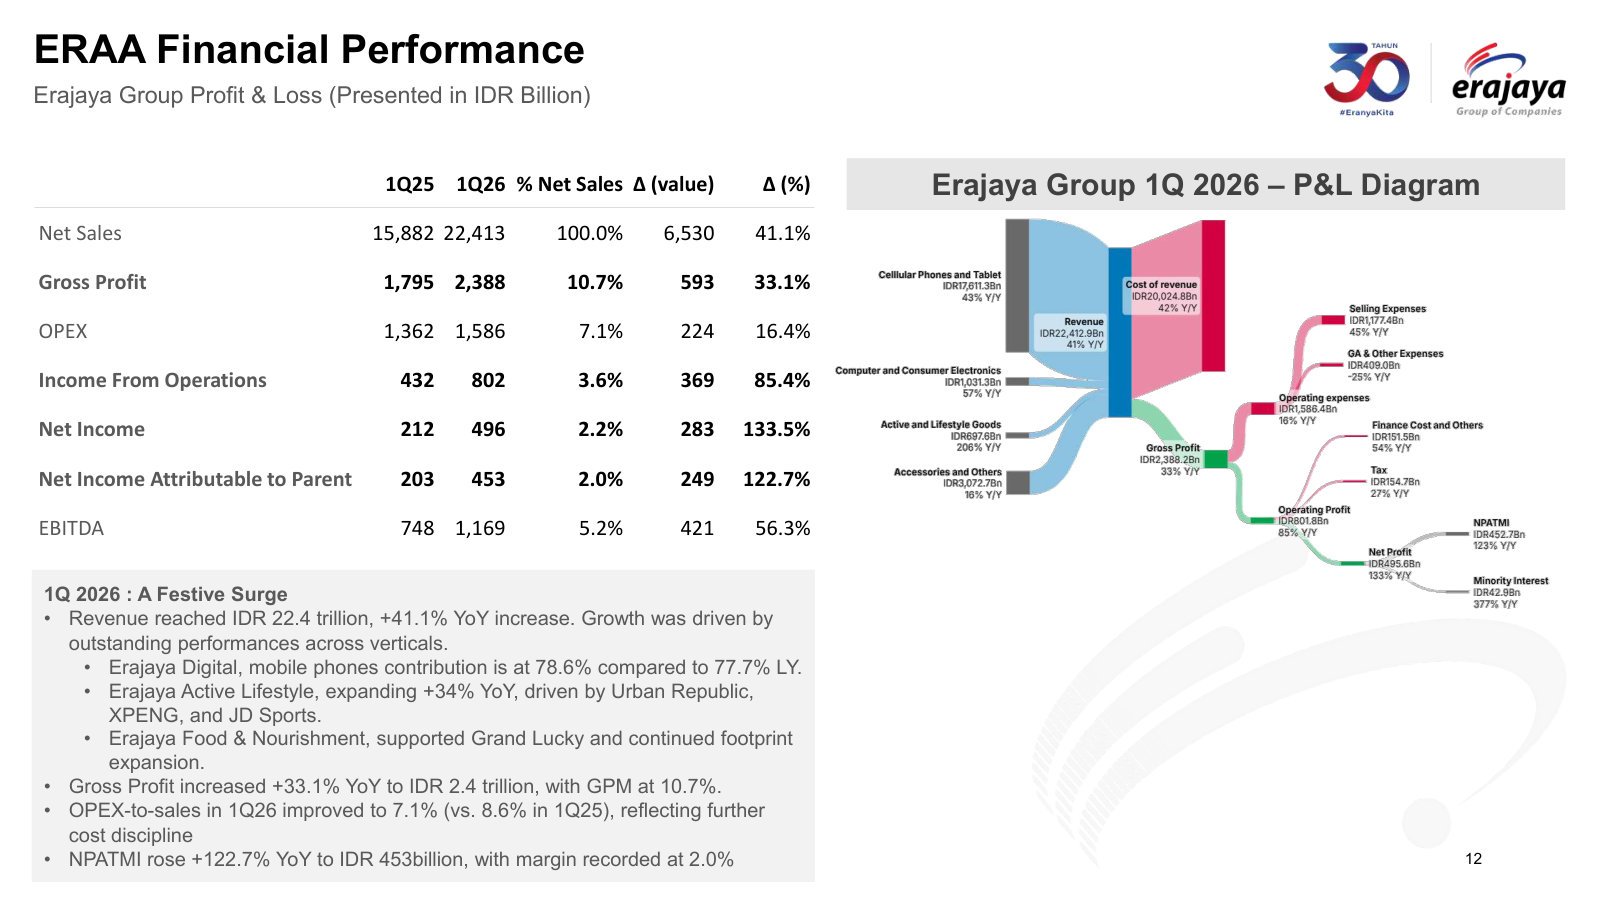
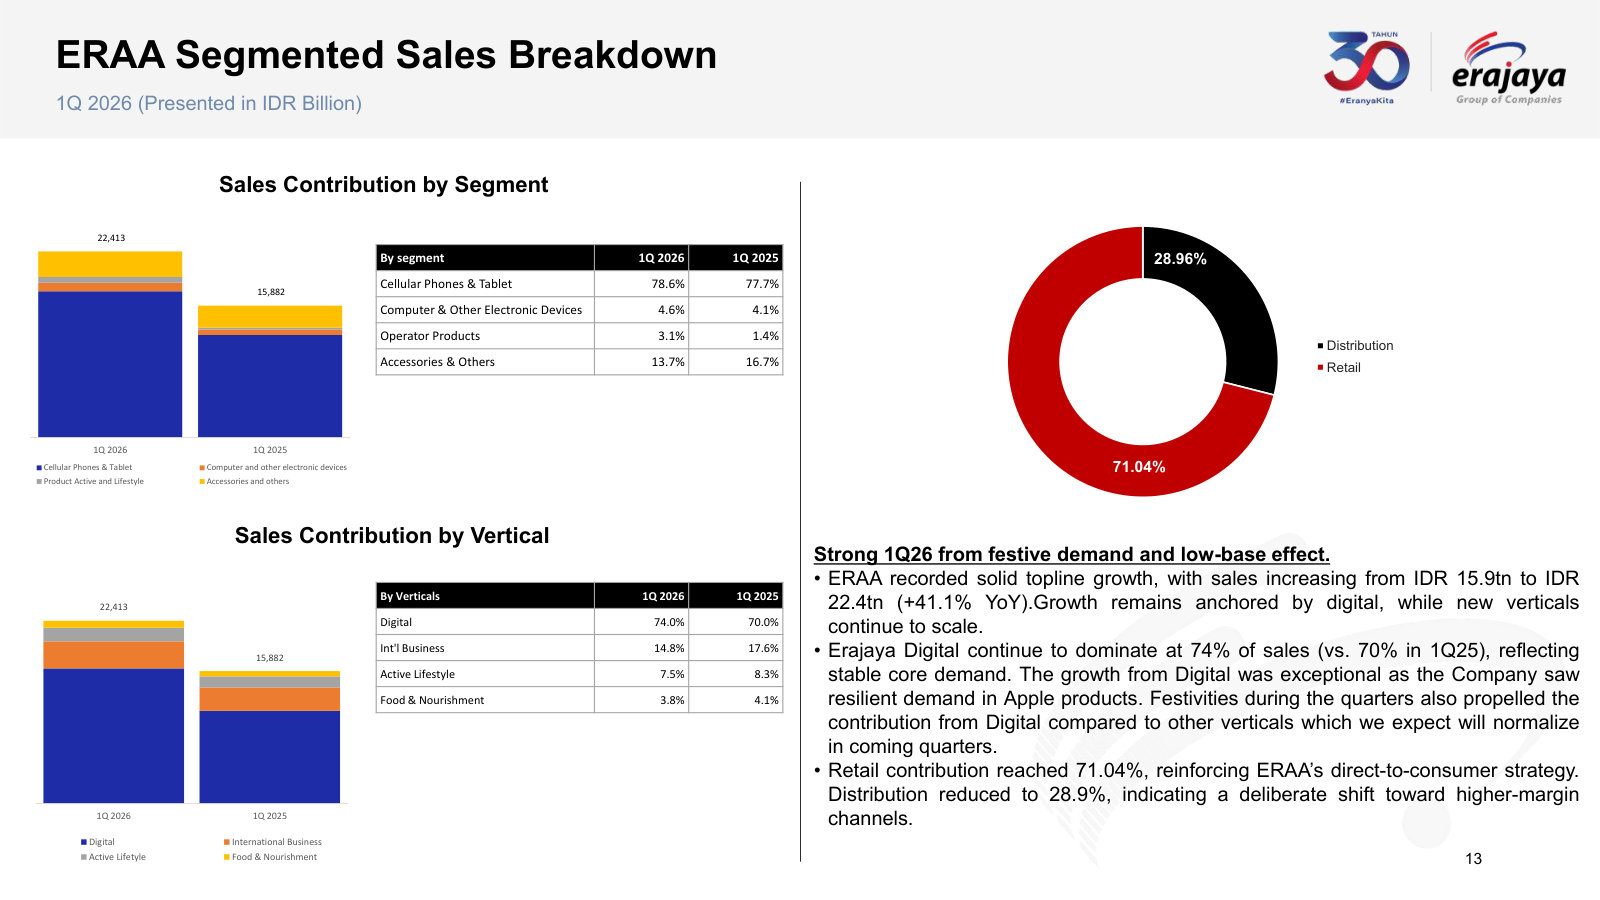
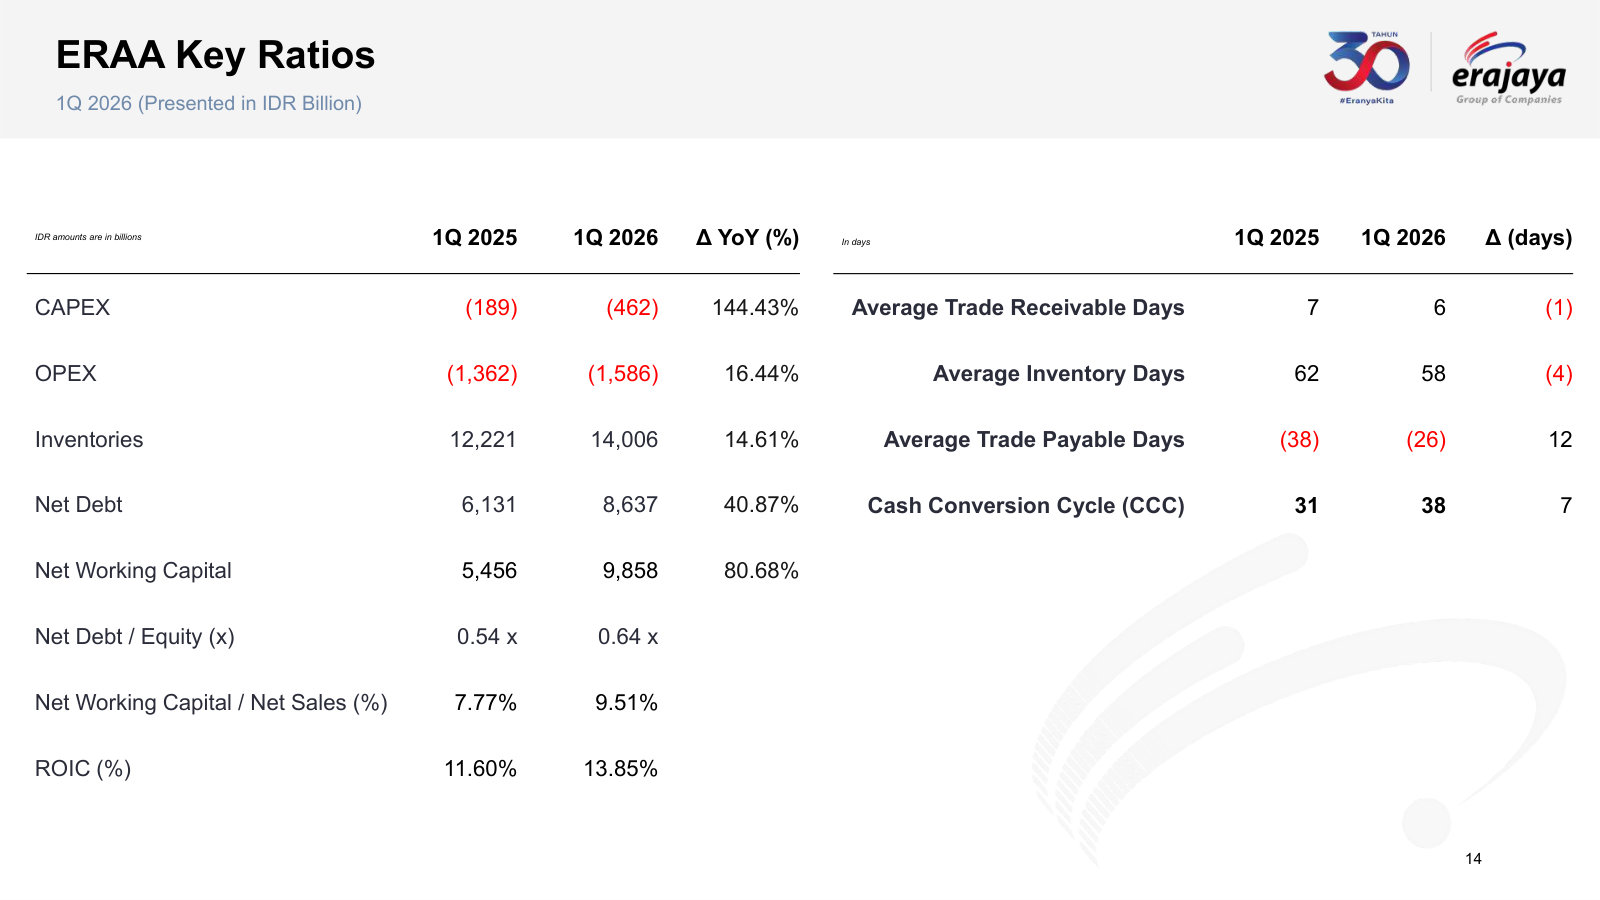
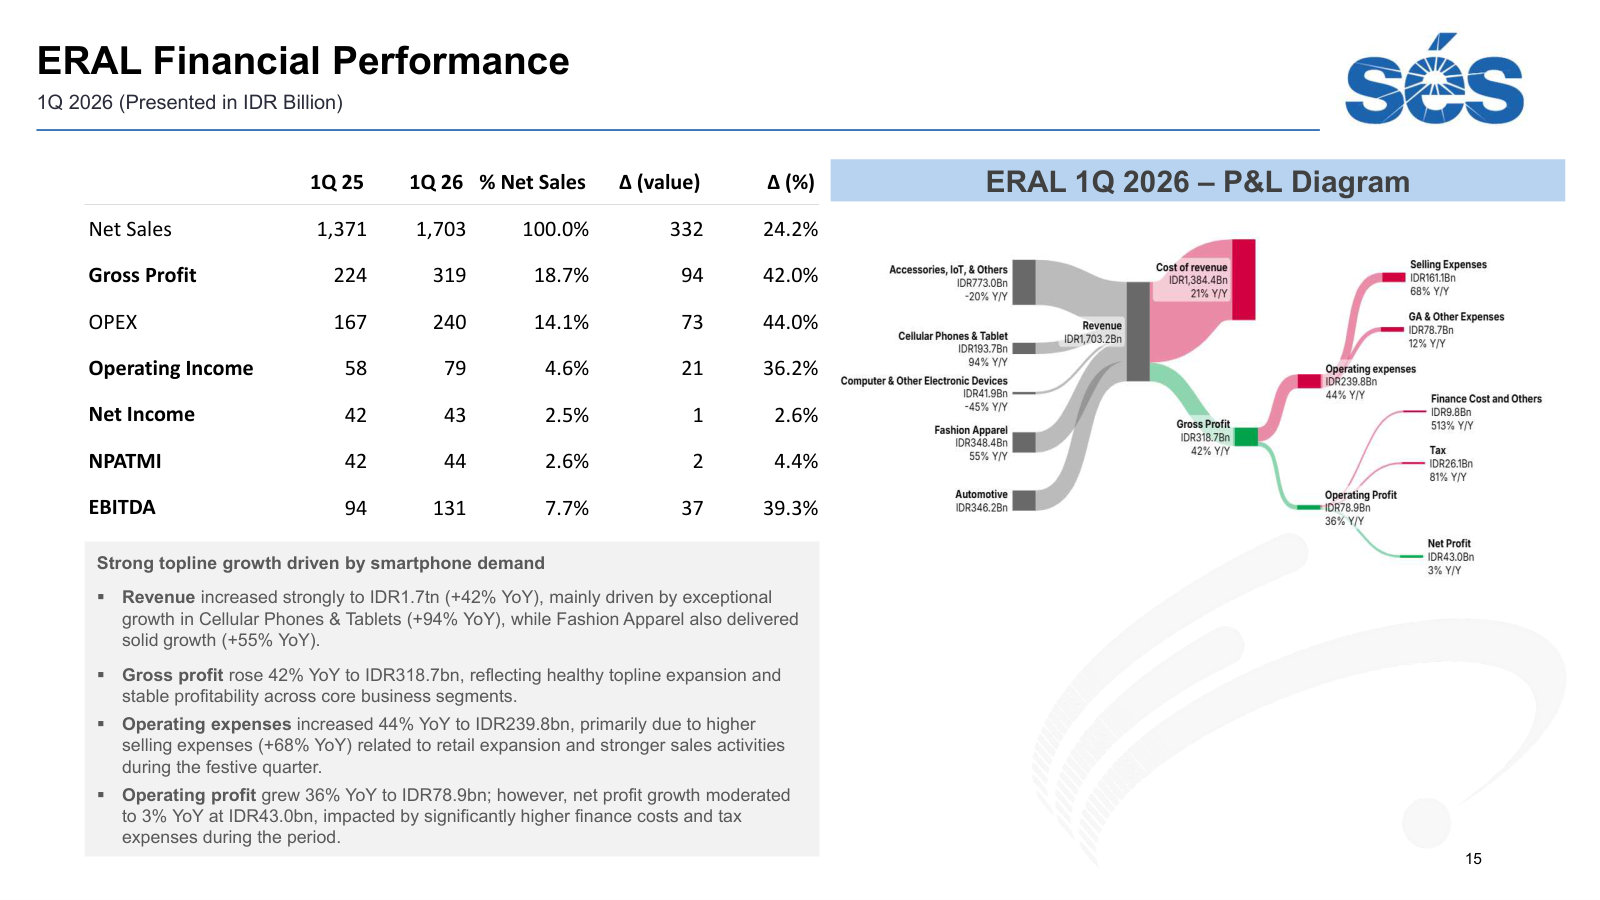
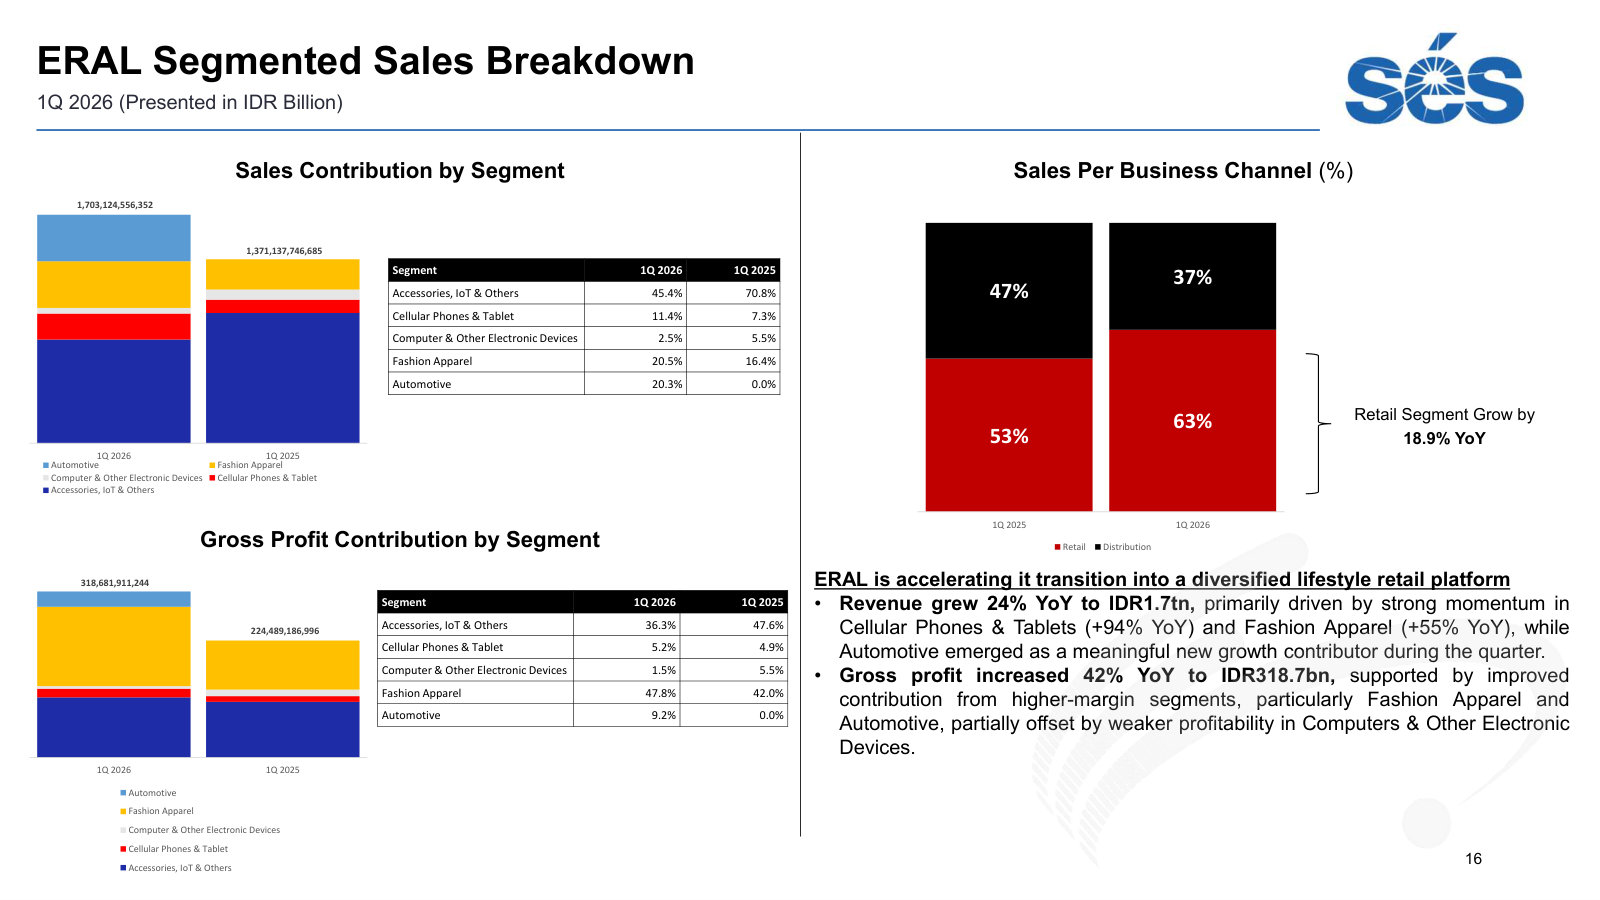
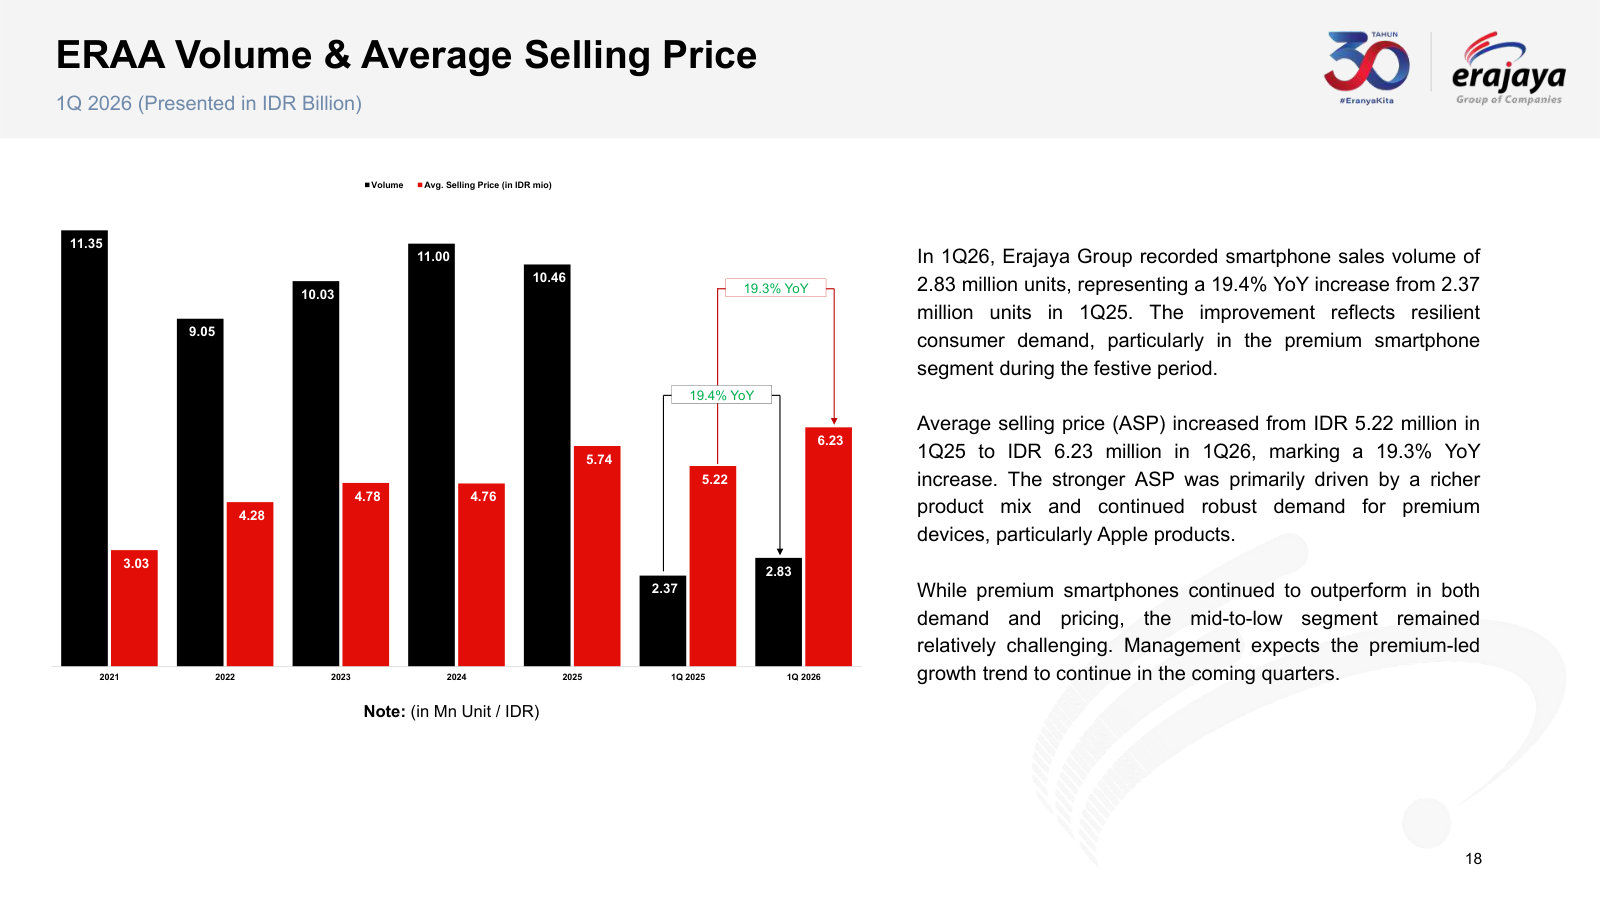
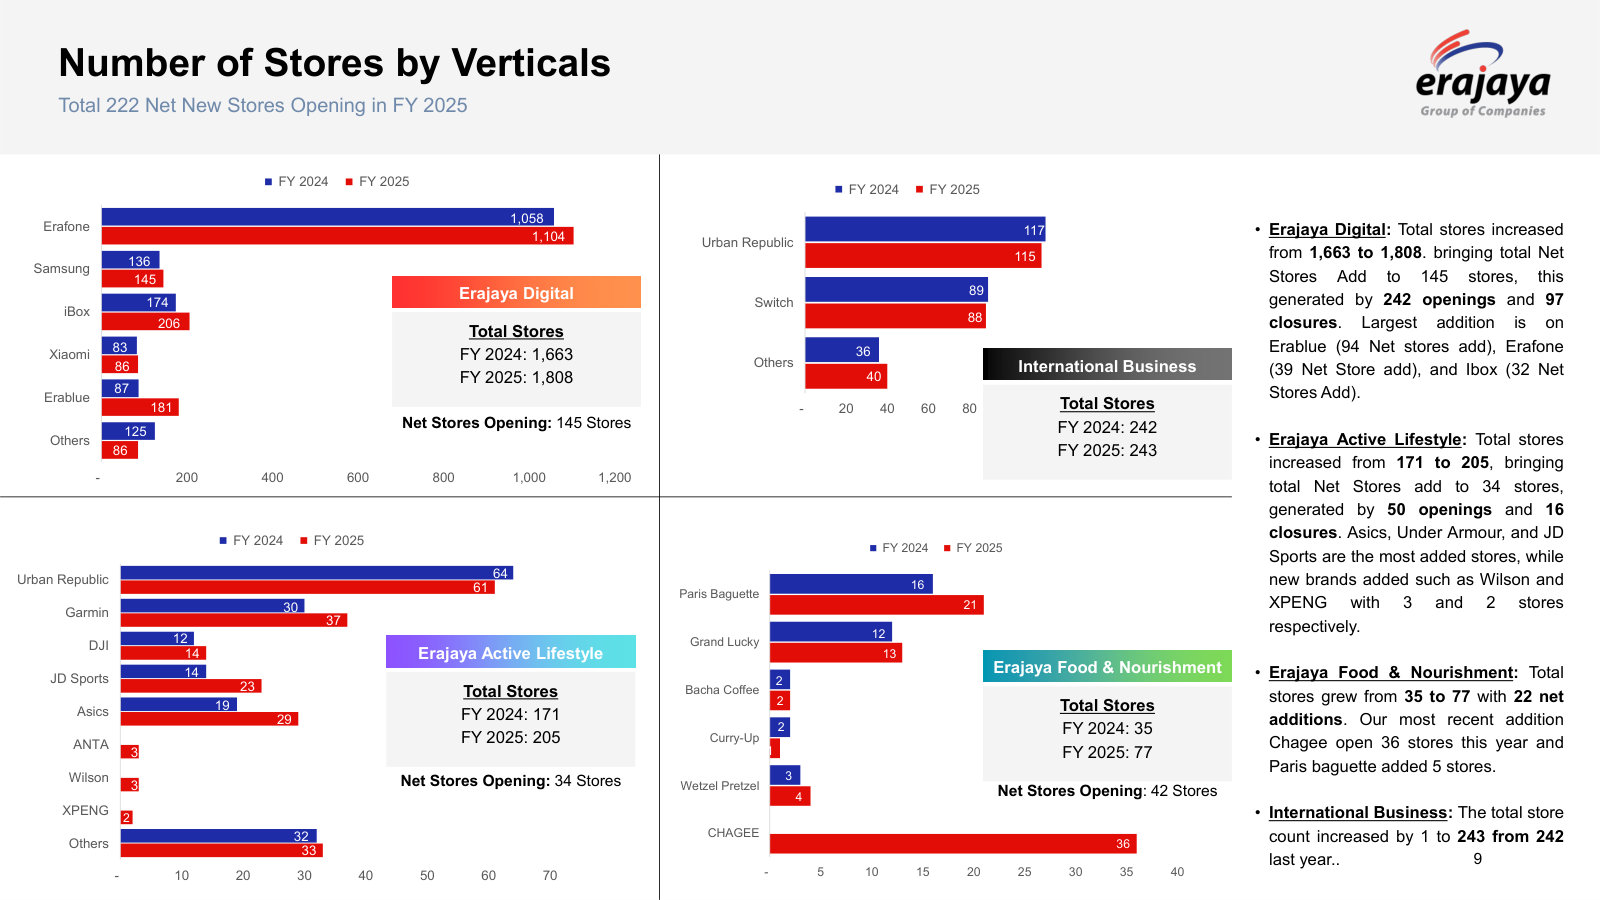
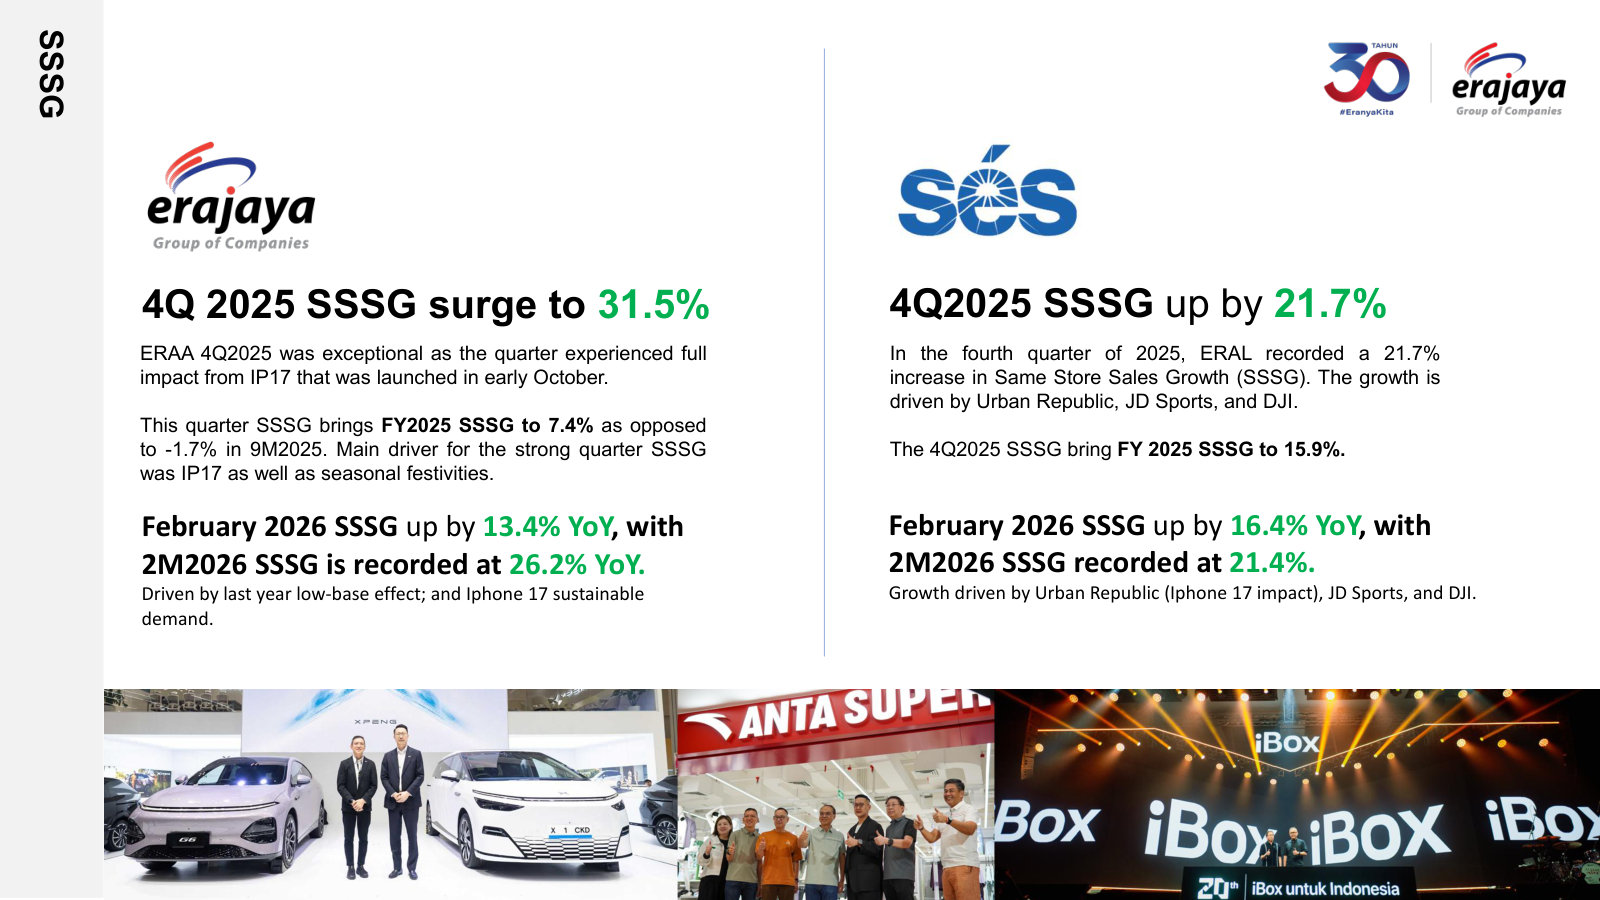
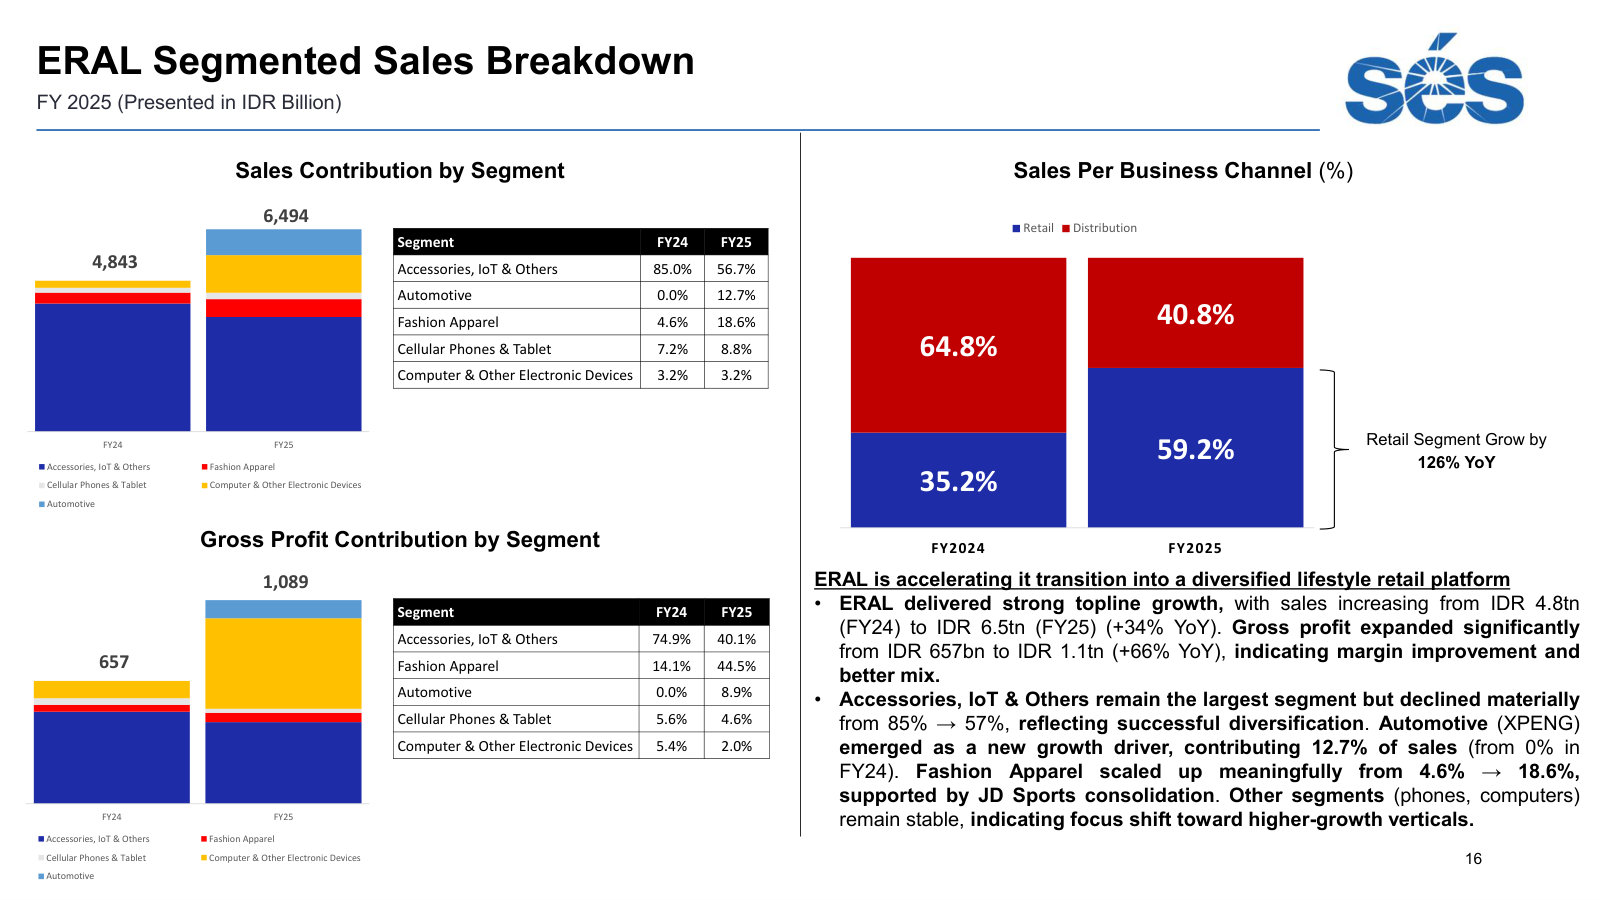
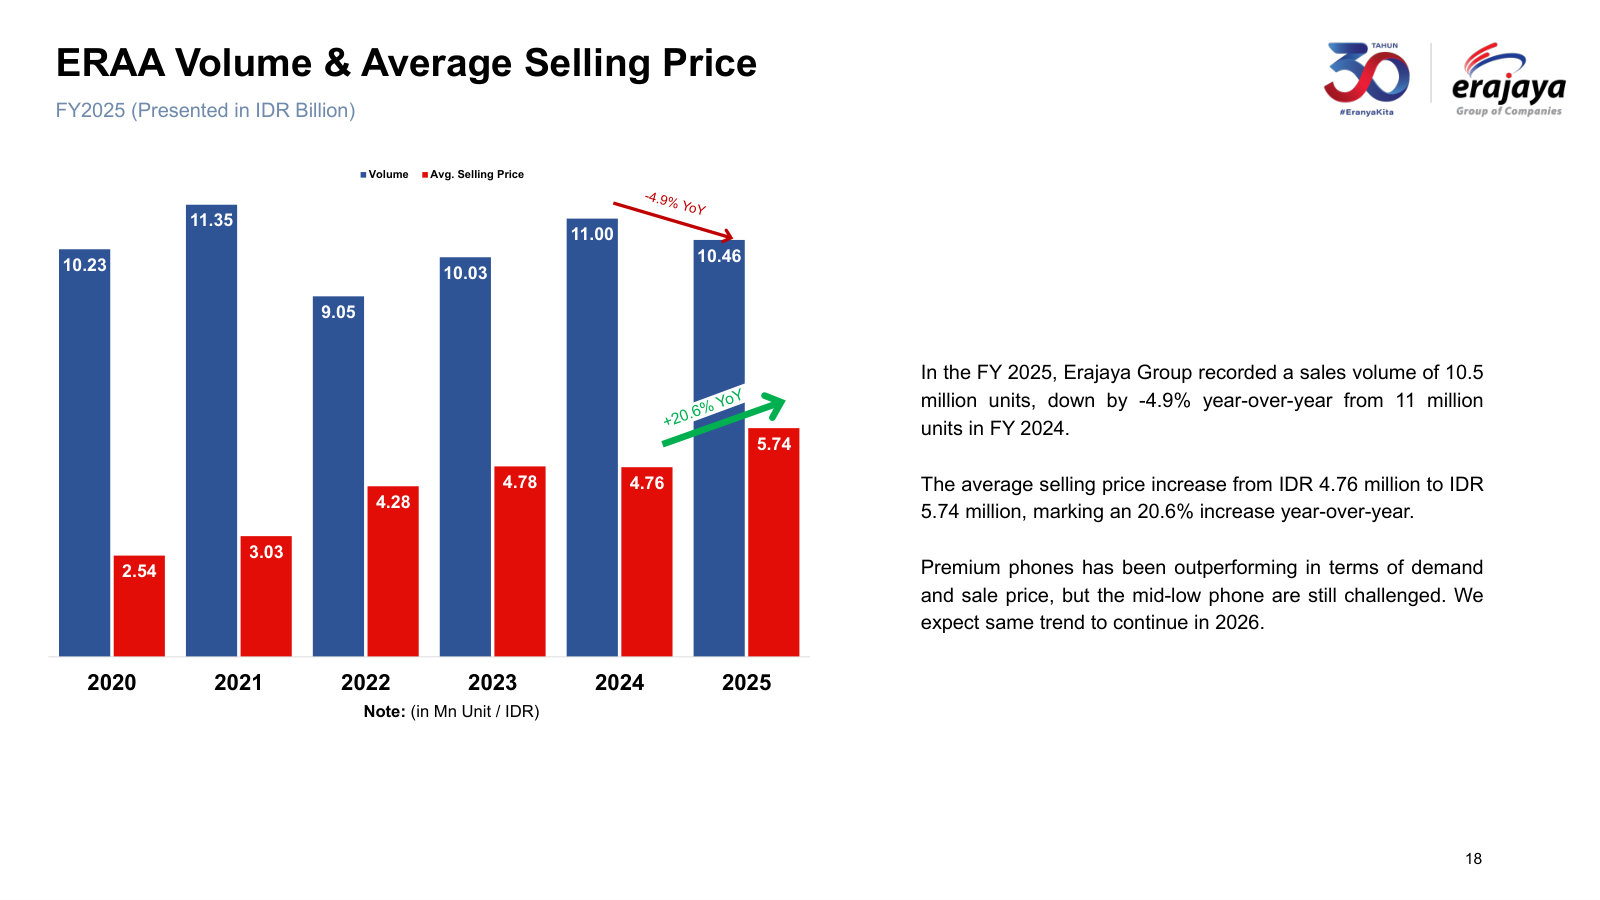
p. 3 — The four-line equity story management leads with: handset scale, higher-margin diversification, omni-channel, ESG. · Open the full presentation →p. 5 — The core business in one page — owned and brand-partner store formats, 1,859 domestic and 242 international stores, mall versus street mix. · Open the full presentation →p. 6 — Erajaya Digital's three stated growth levers: broader audience, wider brand portfolio, more value per store visit. · Open the full presentation →p. 7 — Erajaya Active Lifestyle, the listed subsidiary ERAL: its brand stable, 219 stores, and the 5–6 brands and 50–60 stores a year plan. · Open the full presentation →p. 8 — The food and grocery vertical — Paris Baguette, Grand Lucky, Chagee, Bacha Coffee and others across 84 stores. · Open the full presentation →p. 9 — How the pieces connect: one Eraspace platform spanning own e-commerce, marketplaces, chat and 2,333 stores, with 17.5m members. · Open the full presentation →p. 10 — Store counts by vertical and brand, with openings and closures — where the quarter's 71 net new stores came from. · Open the full presentation →p. 11 — Same-store sales growth for both listed entities, with management's own caveat on the low base and expected normalisation. · Open the full presentation →p. 13 — The group P&L beside a Sankey of revenue by product into costs — the clearest single view of how a 10.7% gross margin becomes 2.2% net. · Open the full presentation →p. 14 — Sales split by product segment and by vertical, plus the retail-versus-distribution mix that drives group margin. · Open the full presentation →p. 15 — Working capital and returns: inventory days, cash conversion cycle, net debt to equity and ROIC. · Open the full presentation →p. 16 — ERAL's own P&L and revenue Sankey — the higher-margin subsidiary at 18.7% gross margin against the group's 10.7%. · Open the full presentation →p. 17 — Where ERAL's sales and gross profit actually come from: apparel and automotive now outweigh the legacy accessories base. · Open the full presentation →p. 19 — Handset volume against average selling price since 2021 — units flat to down, price mix doing the work. · Open the full presentation →
The audited full-year 2025 picture: annual P&L, segment mix, working capital and the volume-versus-price series at full-year scale. · Open the full document →
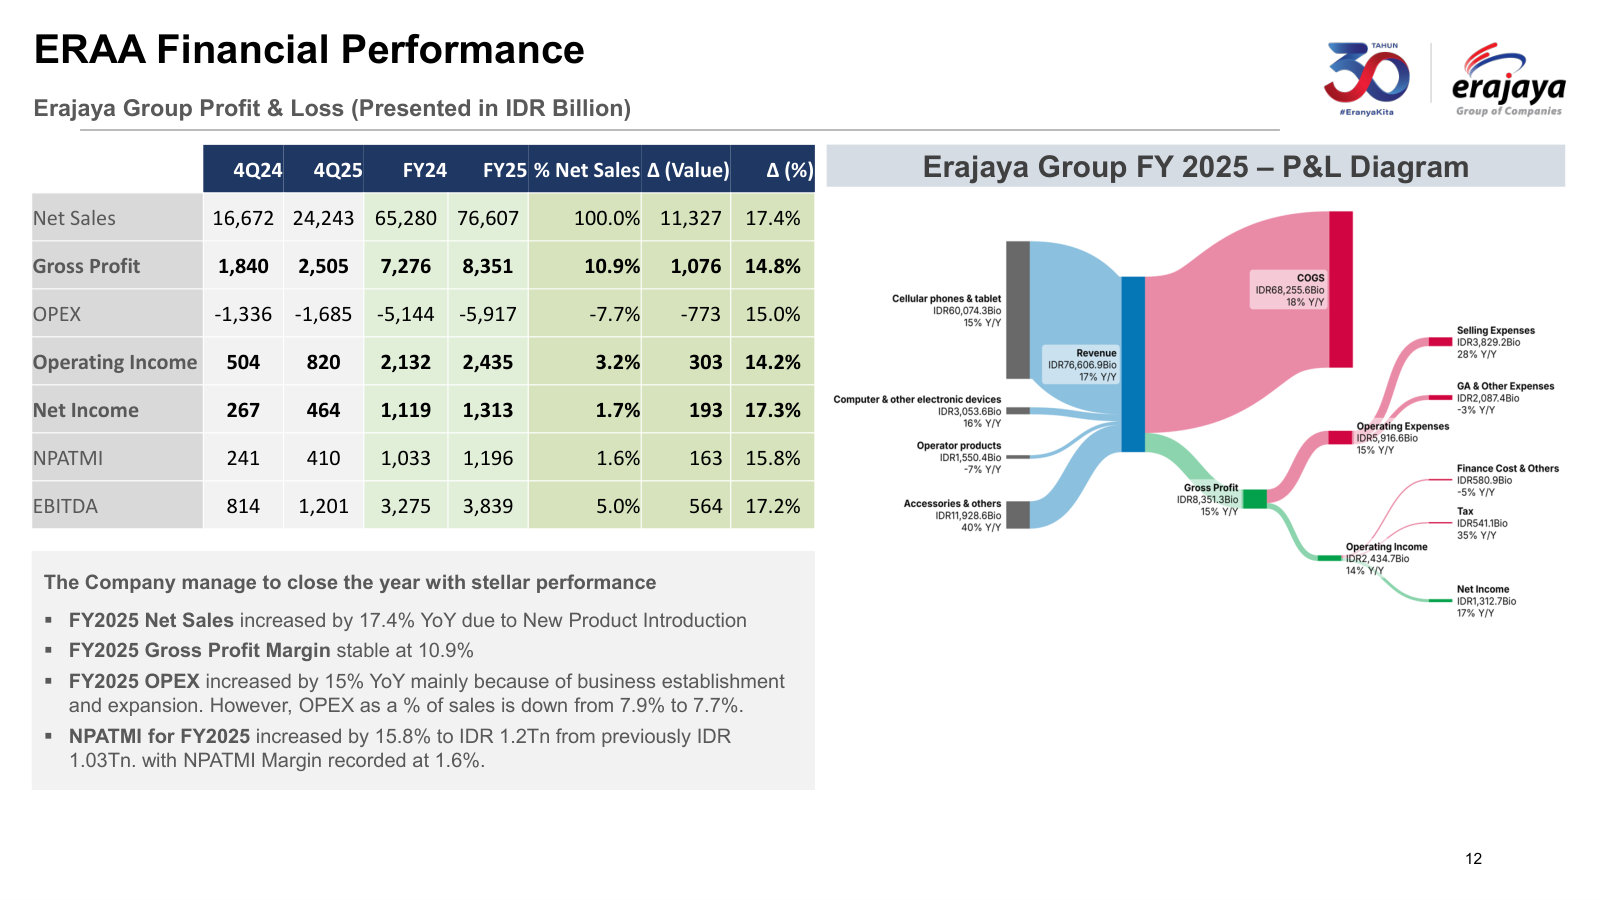
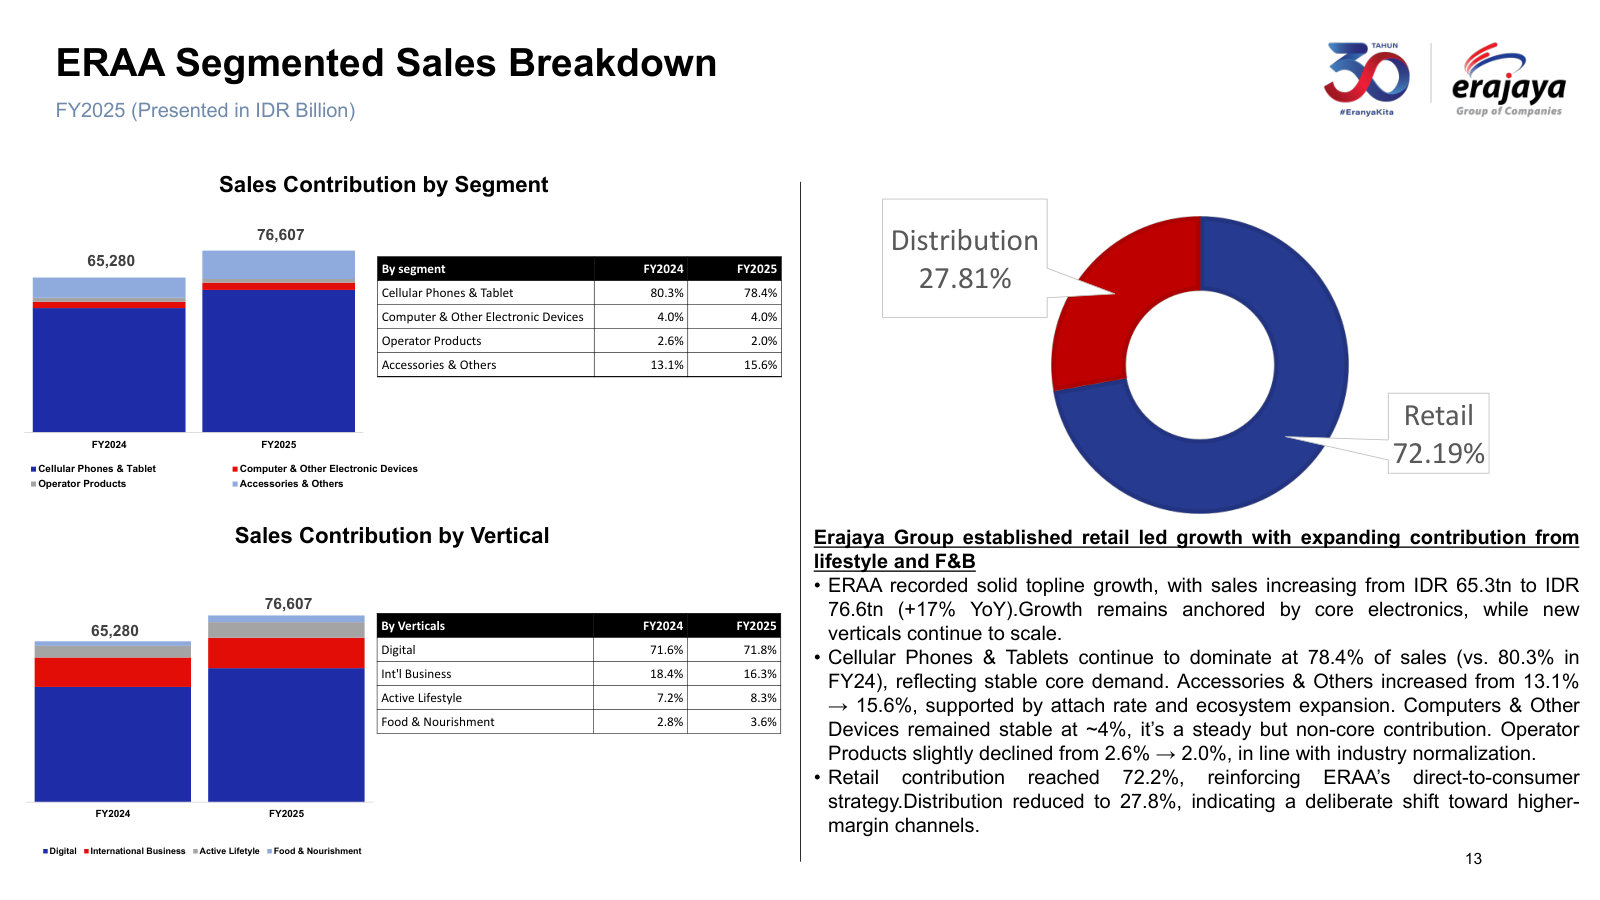
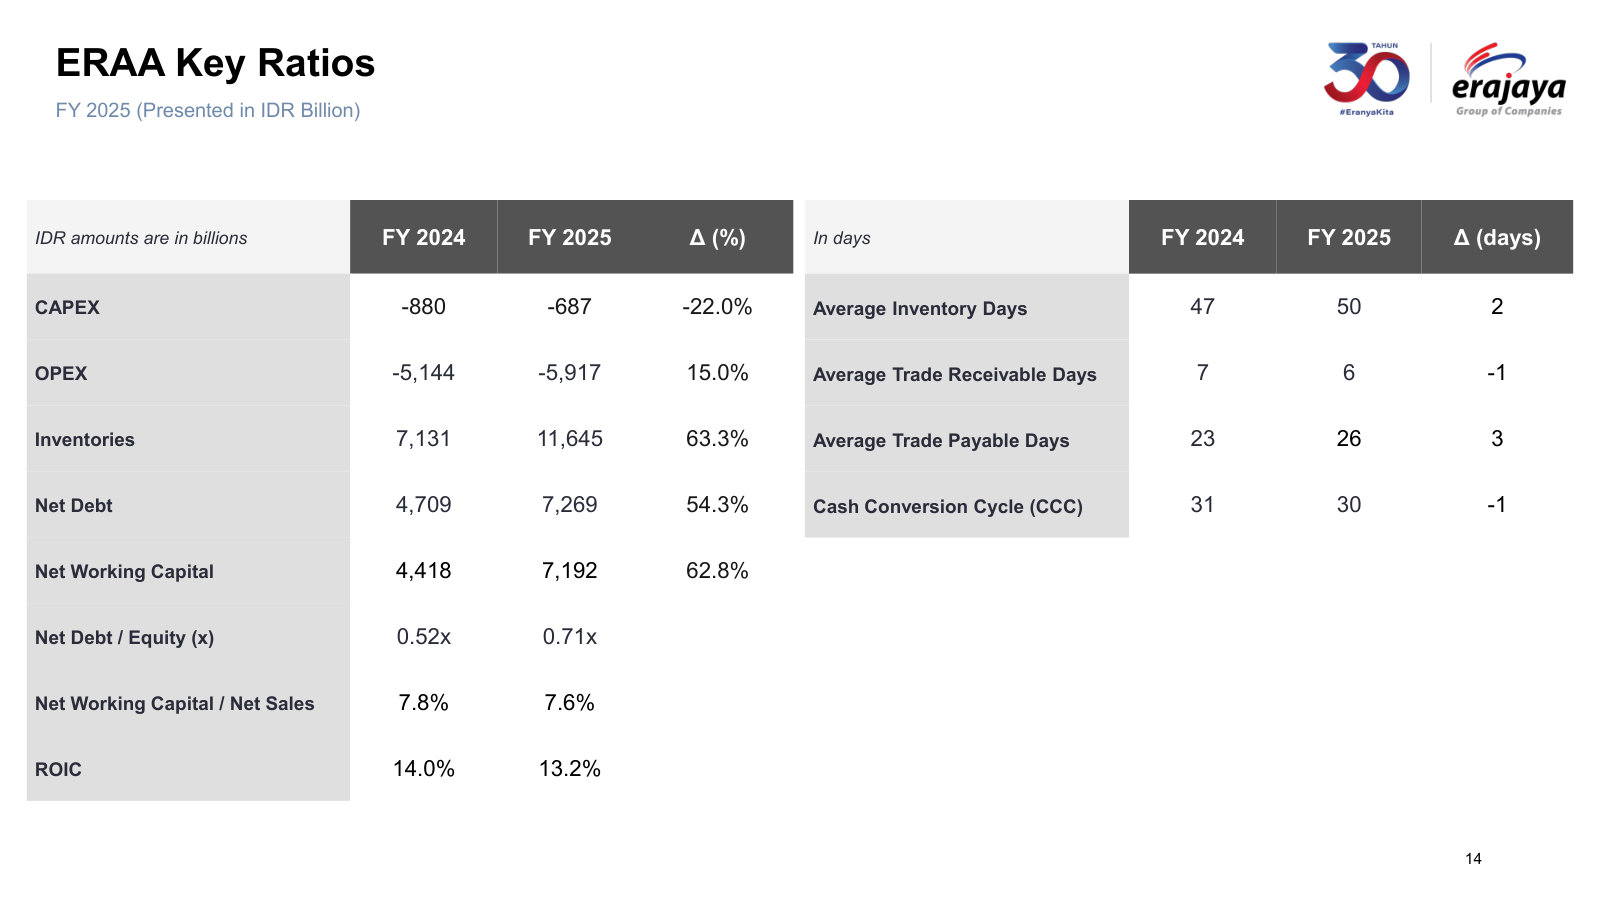
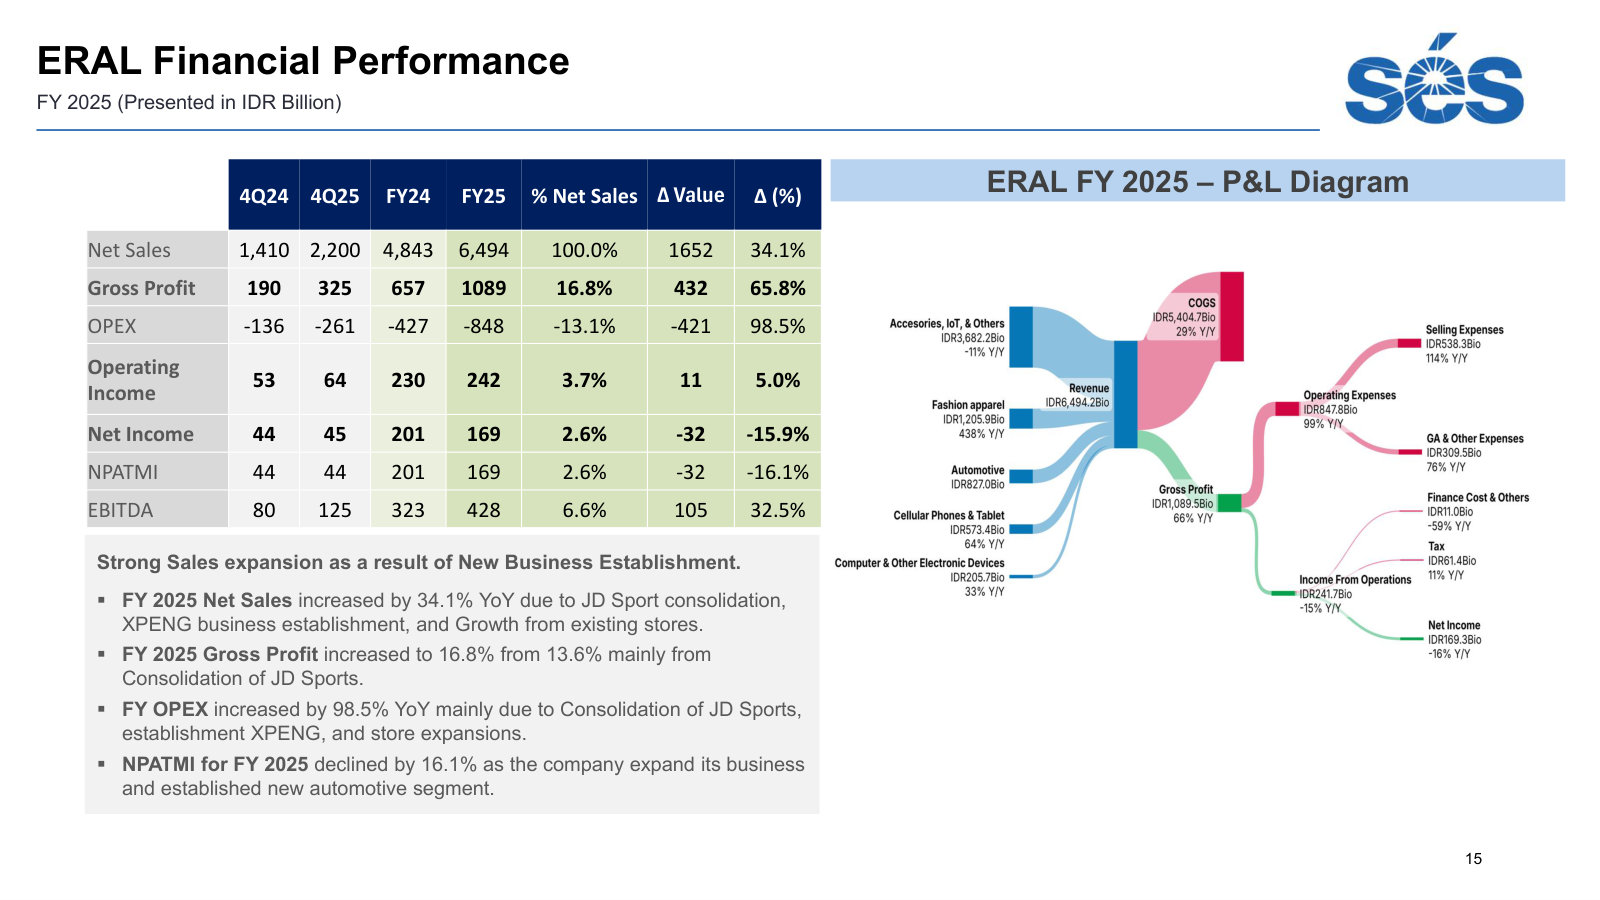
p. 10 — The FY2025 network build in full — 222 net new stores, with openings and closures by brand for each vertical. · Open the full presentation →p. 11 — The full-year SSSG picture: 7.4% for FY2025 after -1.7% through nine months, with the iPhone 17 quarter doing the lifting. · Open the full presentation →p. 13 — The FY2025 P&L with a revenue-to-net-income Sankey — Rp76.6tn of sales, 10.9% gross margin, 1.6% net margin to parent. · Open the full presentation →p. 14 — Full-year sales by segment and by vertical, and the retail-versus-distribution split at 72/28. · Open the full presentation →p. 15 — Full-year working capital and returns: inventories up 63%, net debt to equity 0.71x, ROIC 13.2%. · Open the full presentation →p. 16 — ERAL's FY2025 accounts — sales up 34% on the JD Sports consolidation and XPENG launch, but net profit down 16%. · Open the full presentation →p. 17 — How ERAL's mix changed in a single year: accessories from 85% to 57% of sales, with apparel and automotive taking the rest. · Open the full presentation →p. 19 — Six years of handset volume and average selling price — 2025 units below 2021 with ASP more than doubled. · Open the full presentation →
The last overview-style deck: company history, national footprint, the market-share record, and each vertical with its gross margin. · Open the full document →
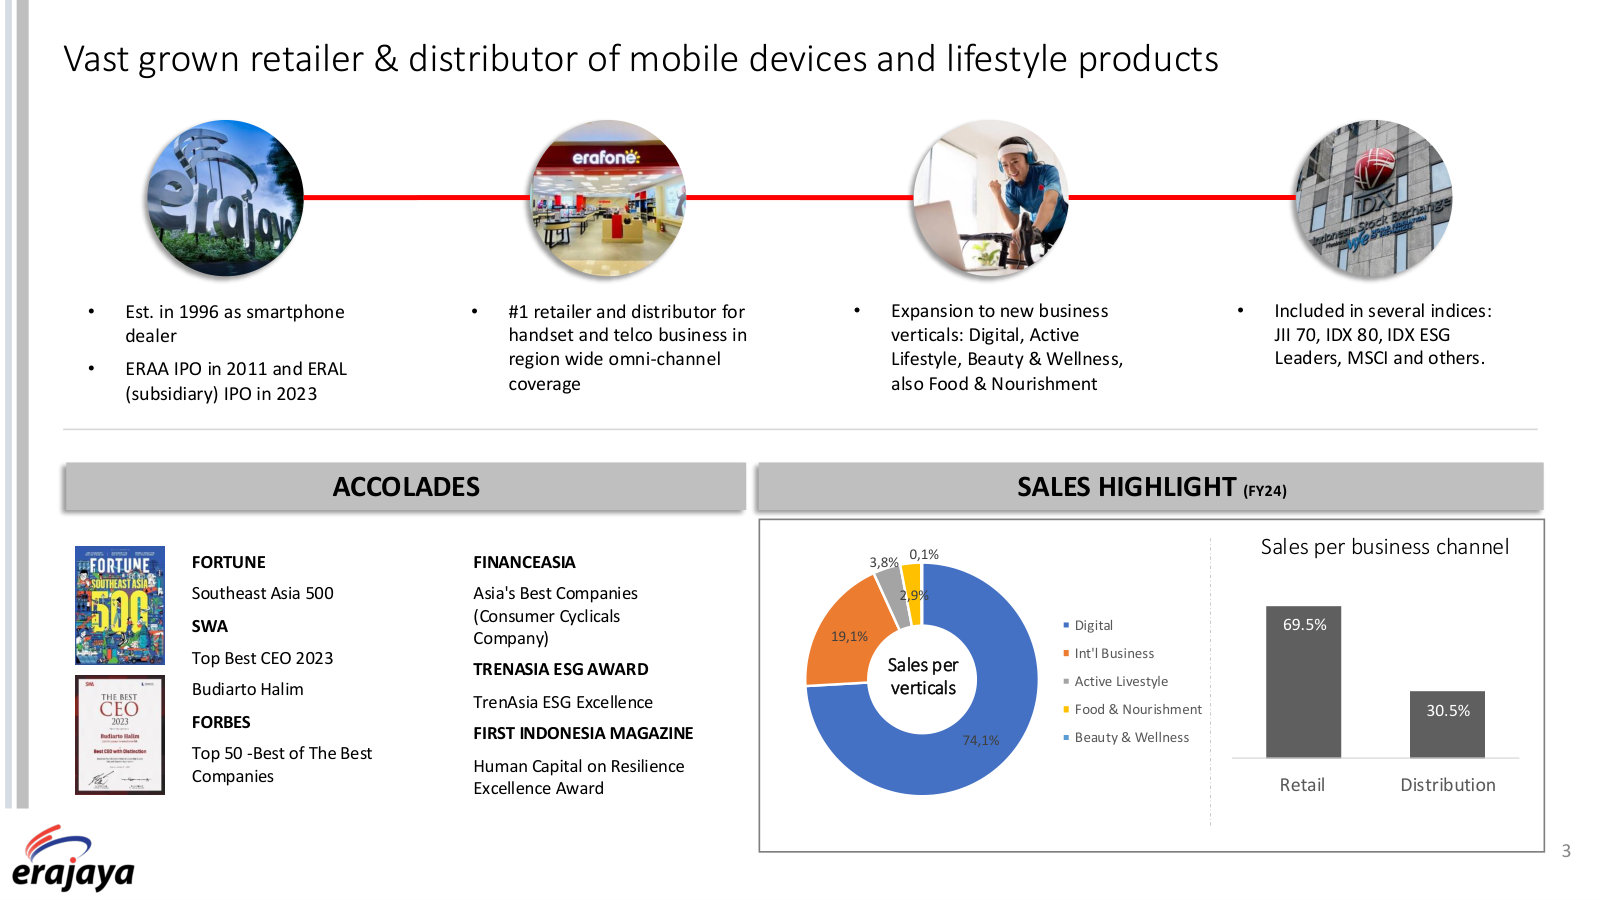
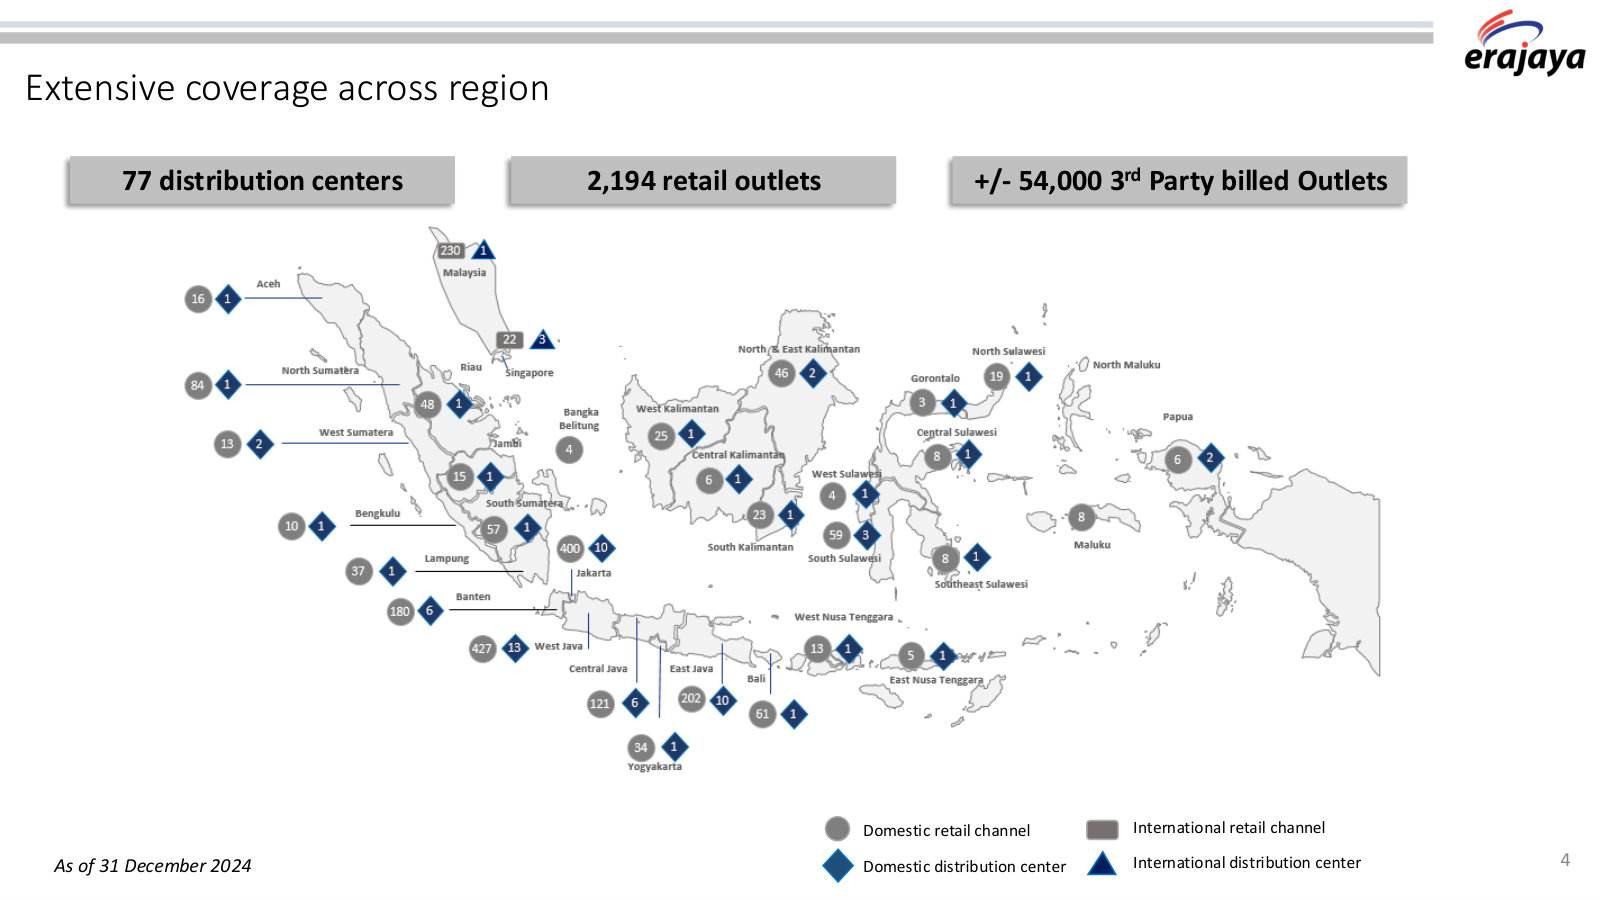
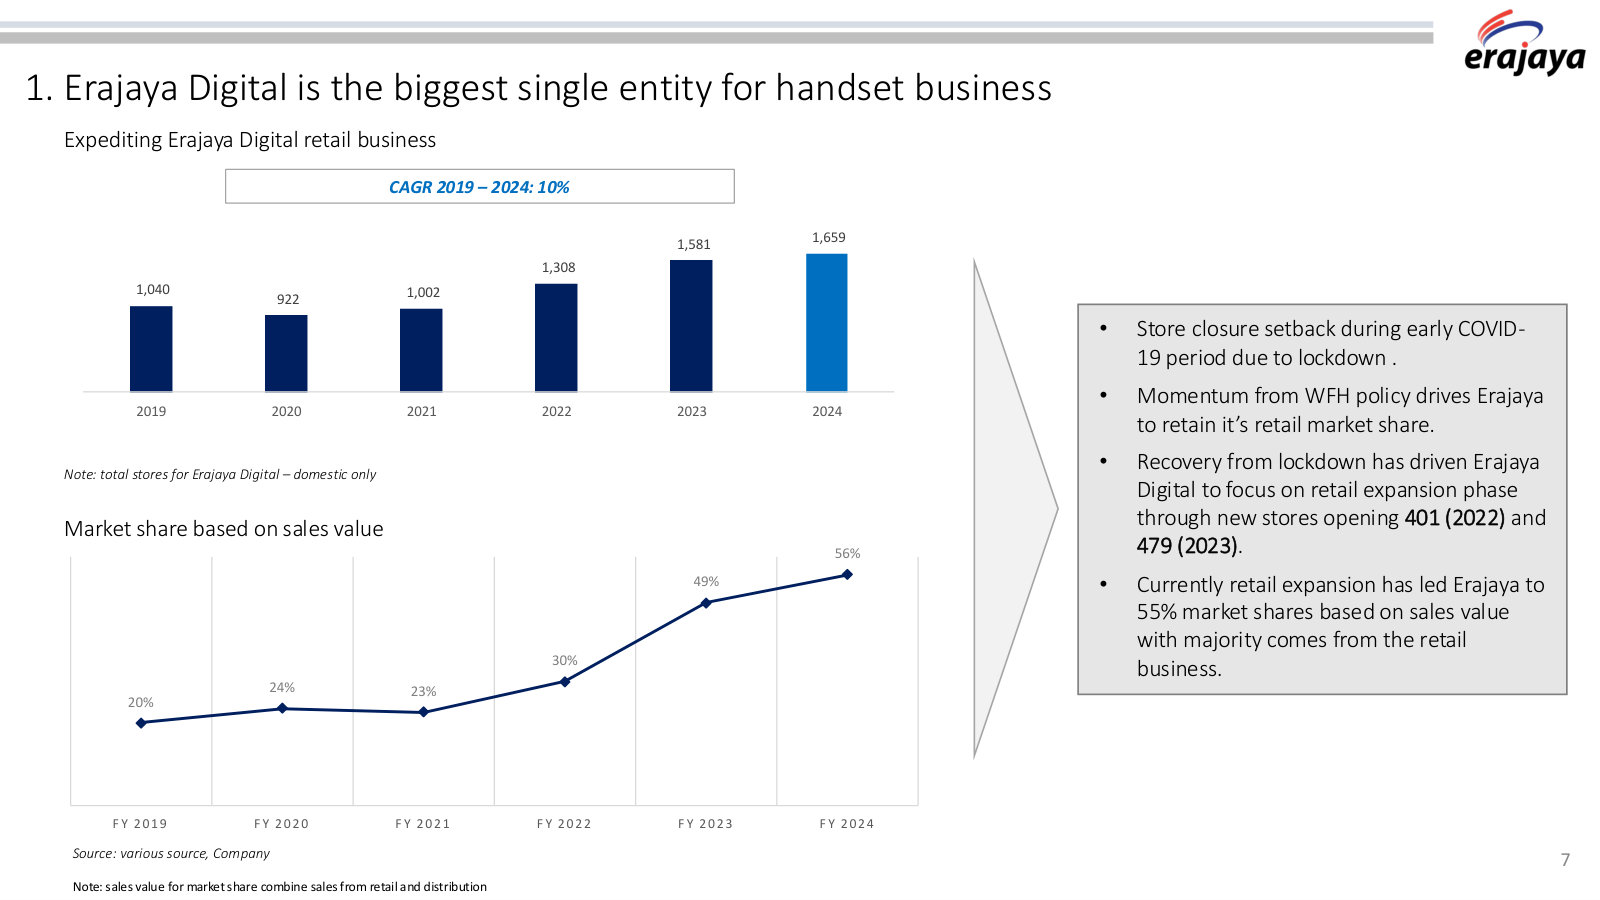
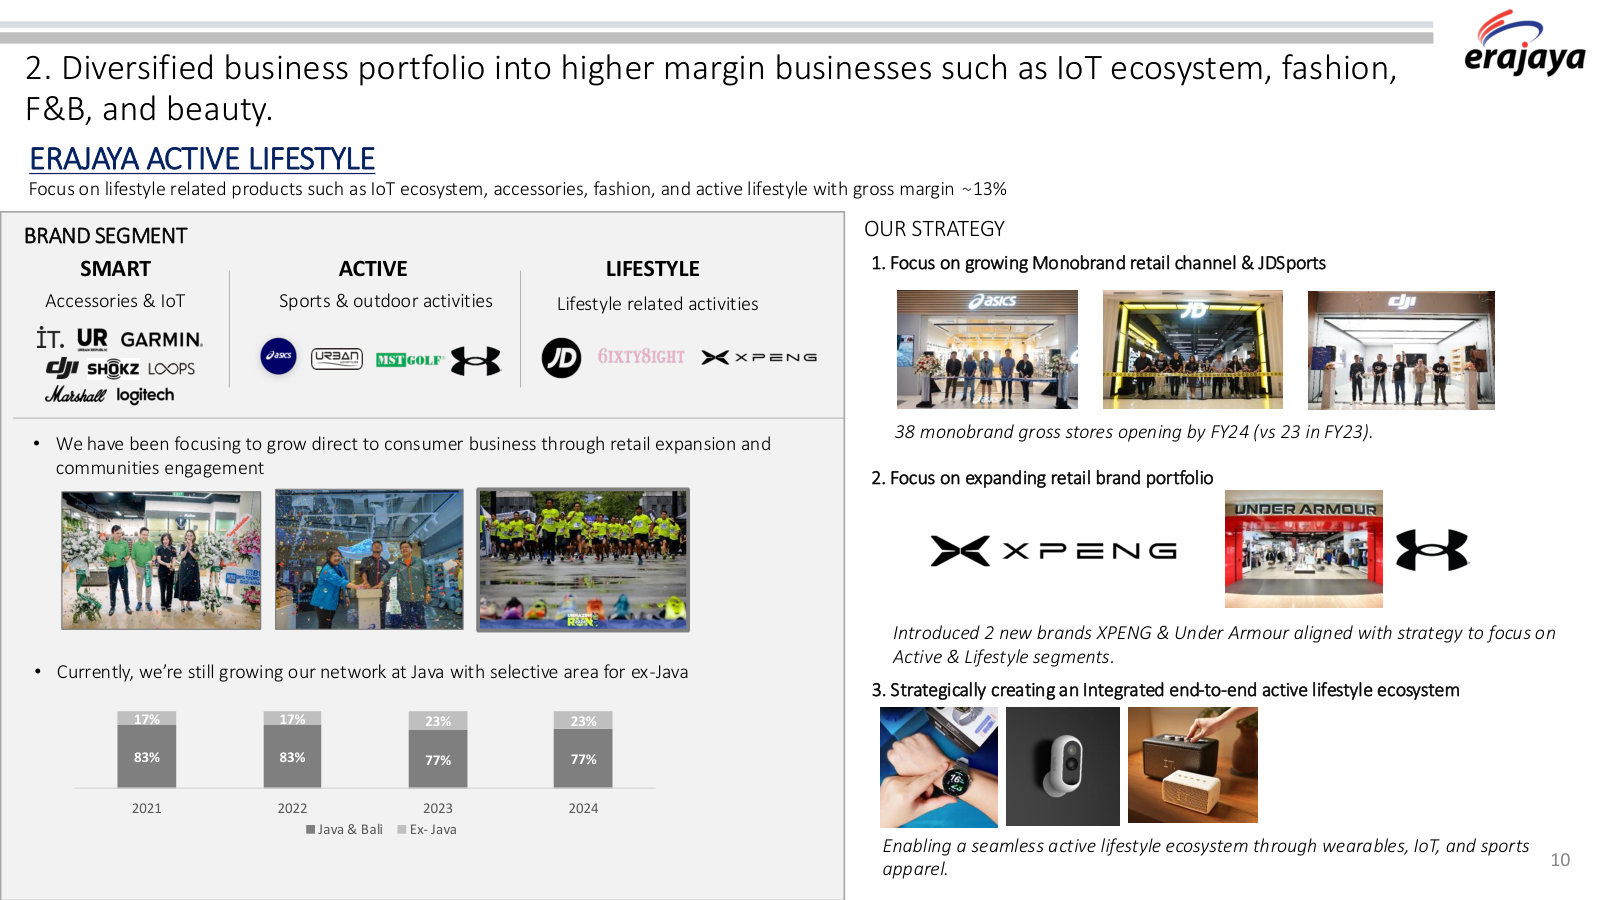
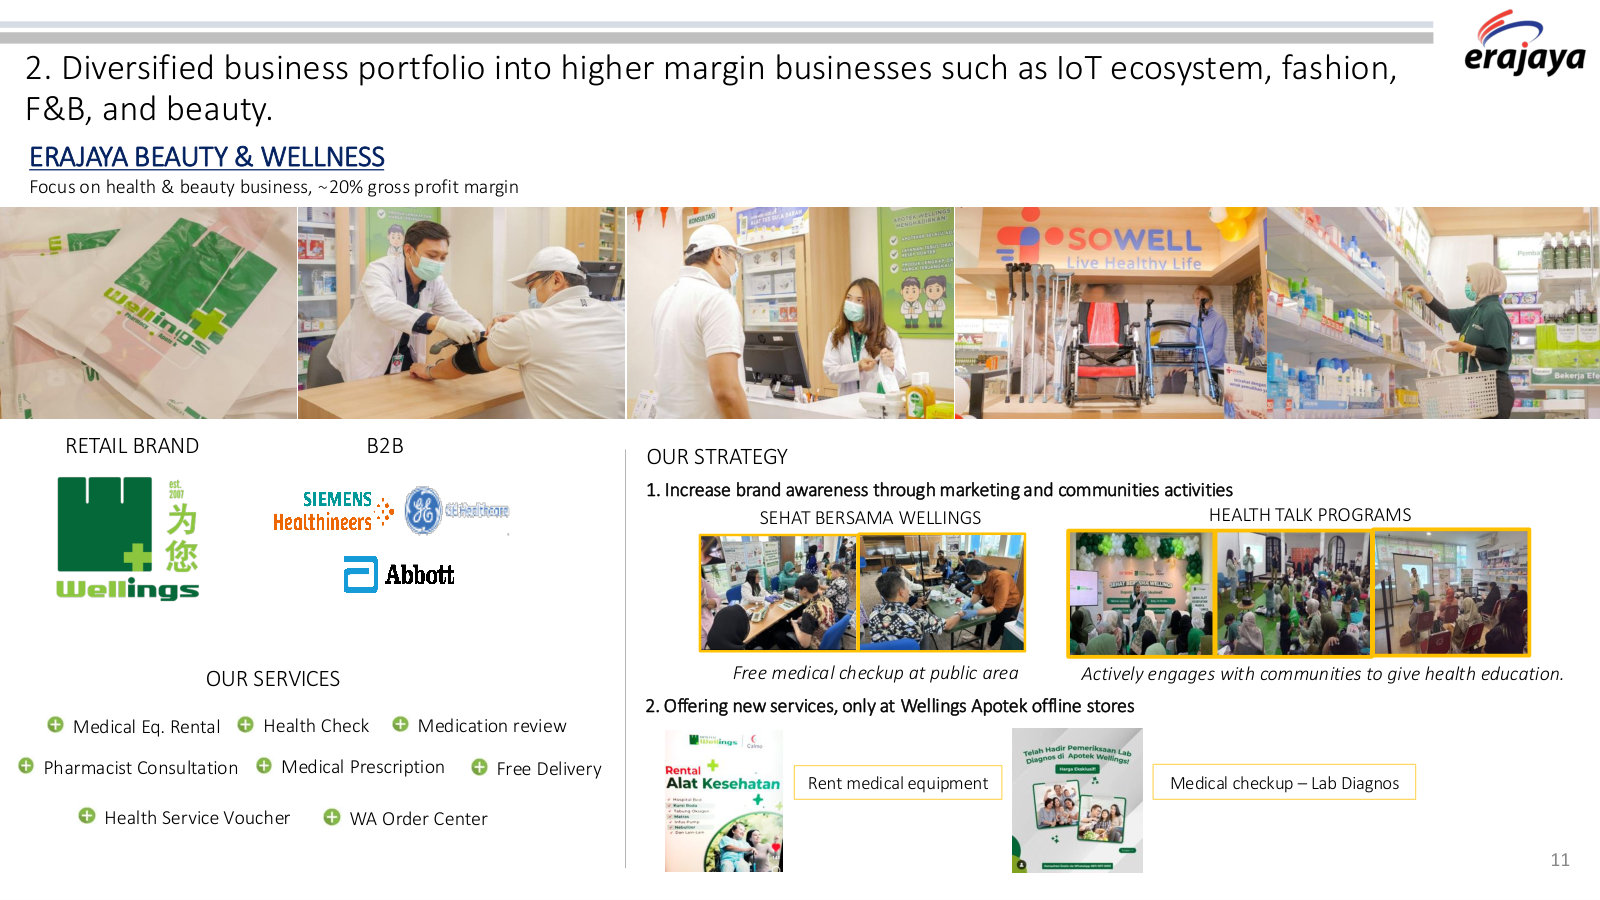
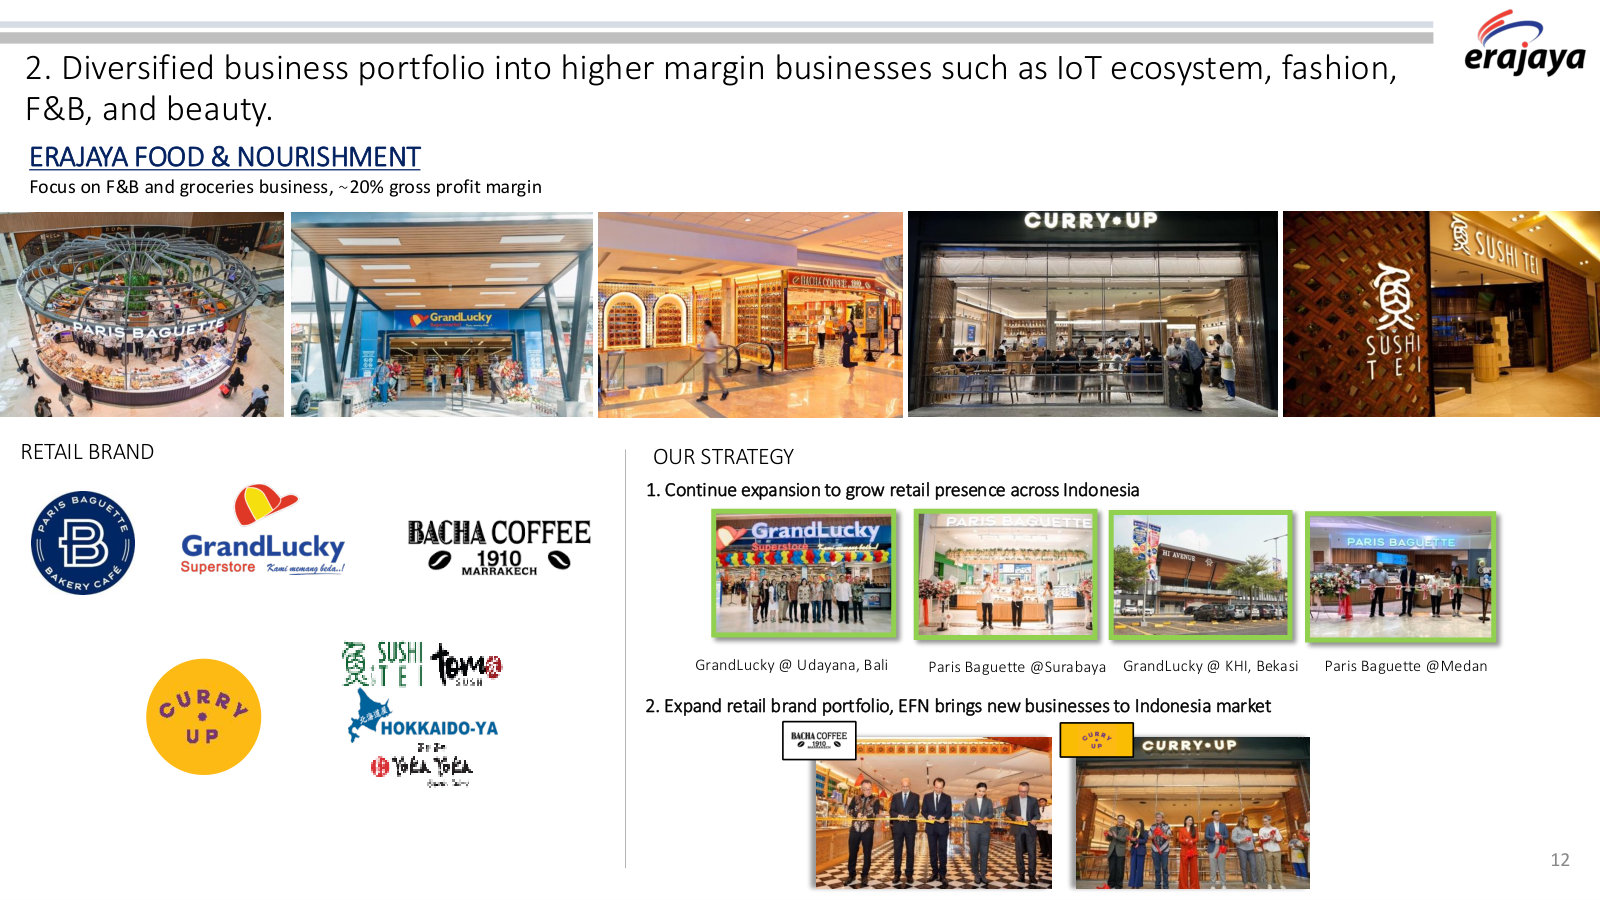
p. 3 — The company in one page — founded 1996, IPO 2011, ERAL IPO 2023, with the FY2024 sales split by vertical and by channel. · Open the full presentation →p. 4 — The physical footprint mapped: 77 distribution centres, 2,194 retail outlets and roughly 54,000 third-party billed outlets. · Open the full presentation →p. 7 — The share gain that defines the story — handset market share by sales value from 20% in 2019 to 56% in 2024, on a 10% store CAGR. · Open the full presentation →p. 10 — Erajaya Active Lifestyle with its gross margin stated at about 13%, plus the Java and ex-Java store split. · Open the full presentation →p. 11 — Erajaya Beauty & Wellness, the roughly 20% gross margin pharmacy and health vertical that later decks stopped detailing. · Open the full presentation →p. 12 — Erajaya Food & Nourishment at about 20% gross margin — the brand list and the expansion logic behind it. · Open the full presentation →
Paparan Publik / Public Expose 2026 — 1Q 2026 · 15 pages · The annual IDX public expose, in Indonesian: the same 1Q26 numbers plus a group-at-a-glance page and the conservation and e-waste work. · Open →
Company Update — 9M 2025 — 9M 2025 · 22 pages · The deck just before the iPhone 17 quarter — the -1.7% same-store trough that the FY2025 rebound is measured against. · Open →
Corporate Presentation — 1H 2023 — 1H 2023 · 20 pages · The 2023 corporate deck: the ERAL subsidiary IPO rationale and valuation, and the Malaysia and Singapore store build-out in detail. · Open →